
Dashboard & Navigation
Main dashboard overview, market intelligence ticker, profile settings, notifications, calendar, and portfolio.
Chapter 2: Dashboard & Navigation
The PROPMETRIK dashboard is your command center. It presents real-time market data, key performance indicators, and quick access to every module in the platform. The interface uses a distinctive terminal-style dark theme with amber accents, designed for professionals who spend extended time analyzing data.
2.1 Main Dashboard Overview
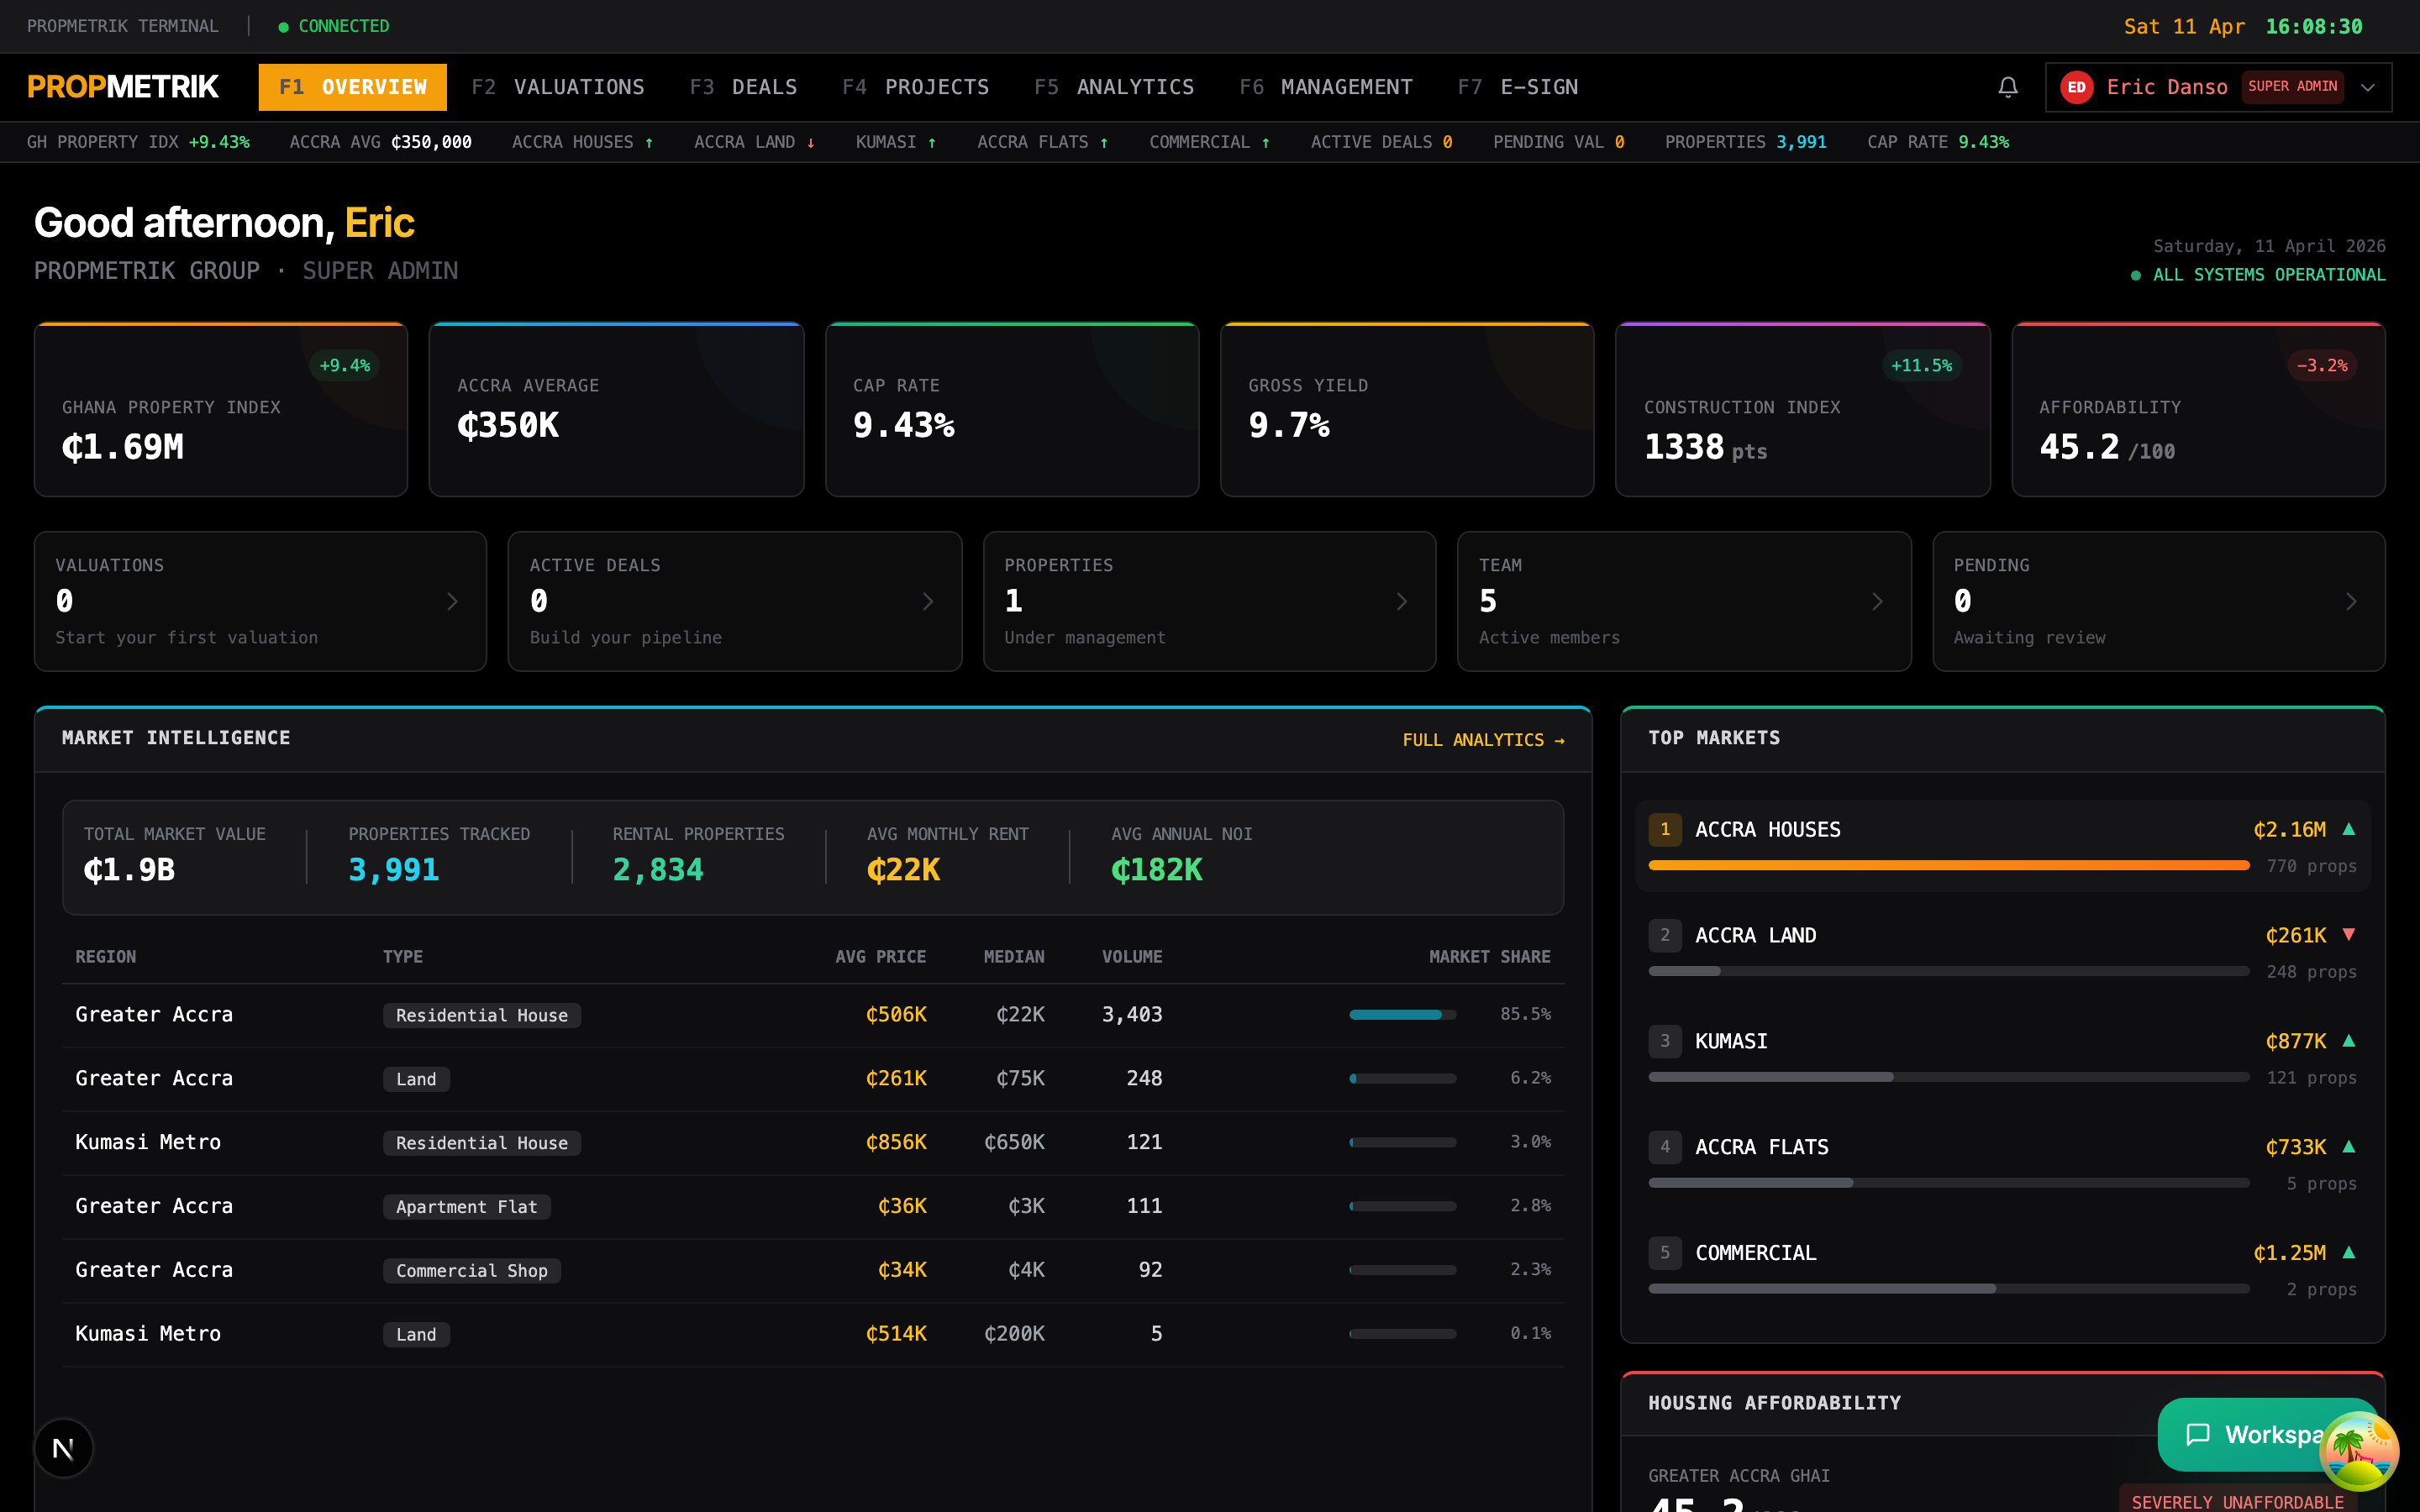
After logging in, you land on the main dashboard. This page provides a comprehensive snapshot of your organization's activity across all modules.
Key Dashboard Sections
The main dashboard is divided into several panels:
Top Ticker Bar A scrolling ticker at the top of the screen displays live market data, including:
- Ghana Property Index -- Average property prices and total listed properties with percentage change.
- Accra Average Price -- The current average property price in Accra.
- Neighborhood Spotlights -- Trending neighborhoods with average prices and directional indicators (up/down).
- Active Deals -- Number of deals currently in your pipeline.
- Pending Valuations -- Valuations awaiting completion.
- Cap Rate -- Current average capitalization rate.
Overview Statistics Below the ticker, a row of summary cards shows:
- Total valuations completed
- Valuations this month
- Active deals in pipeline
- Pipeline value (in GHS)
- Total properties under management
- Team members in your organization
Valuation Queue A panel listing recent valuation requests with their status, priority level, property type, and creation date. Click any item to open the full valuation.
Deal Pipeline A visual representation of your deal pipeline showing the number of deals and total value at each stage (e.g., Lead, Qualified, Proposal, Negotiation, Closed).
Recent Transactions A feed of the most recent property transactions including transaction type, property name, location, value, and date.
2.2 Market Intelligence Panels
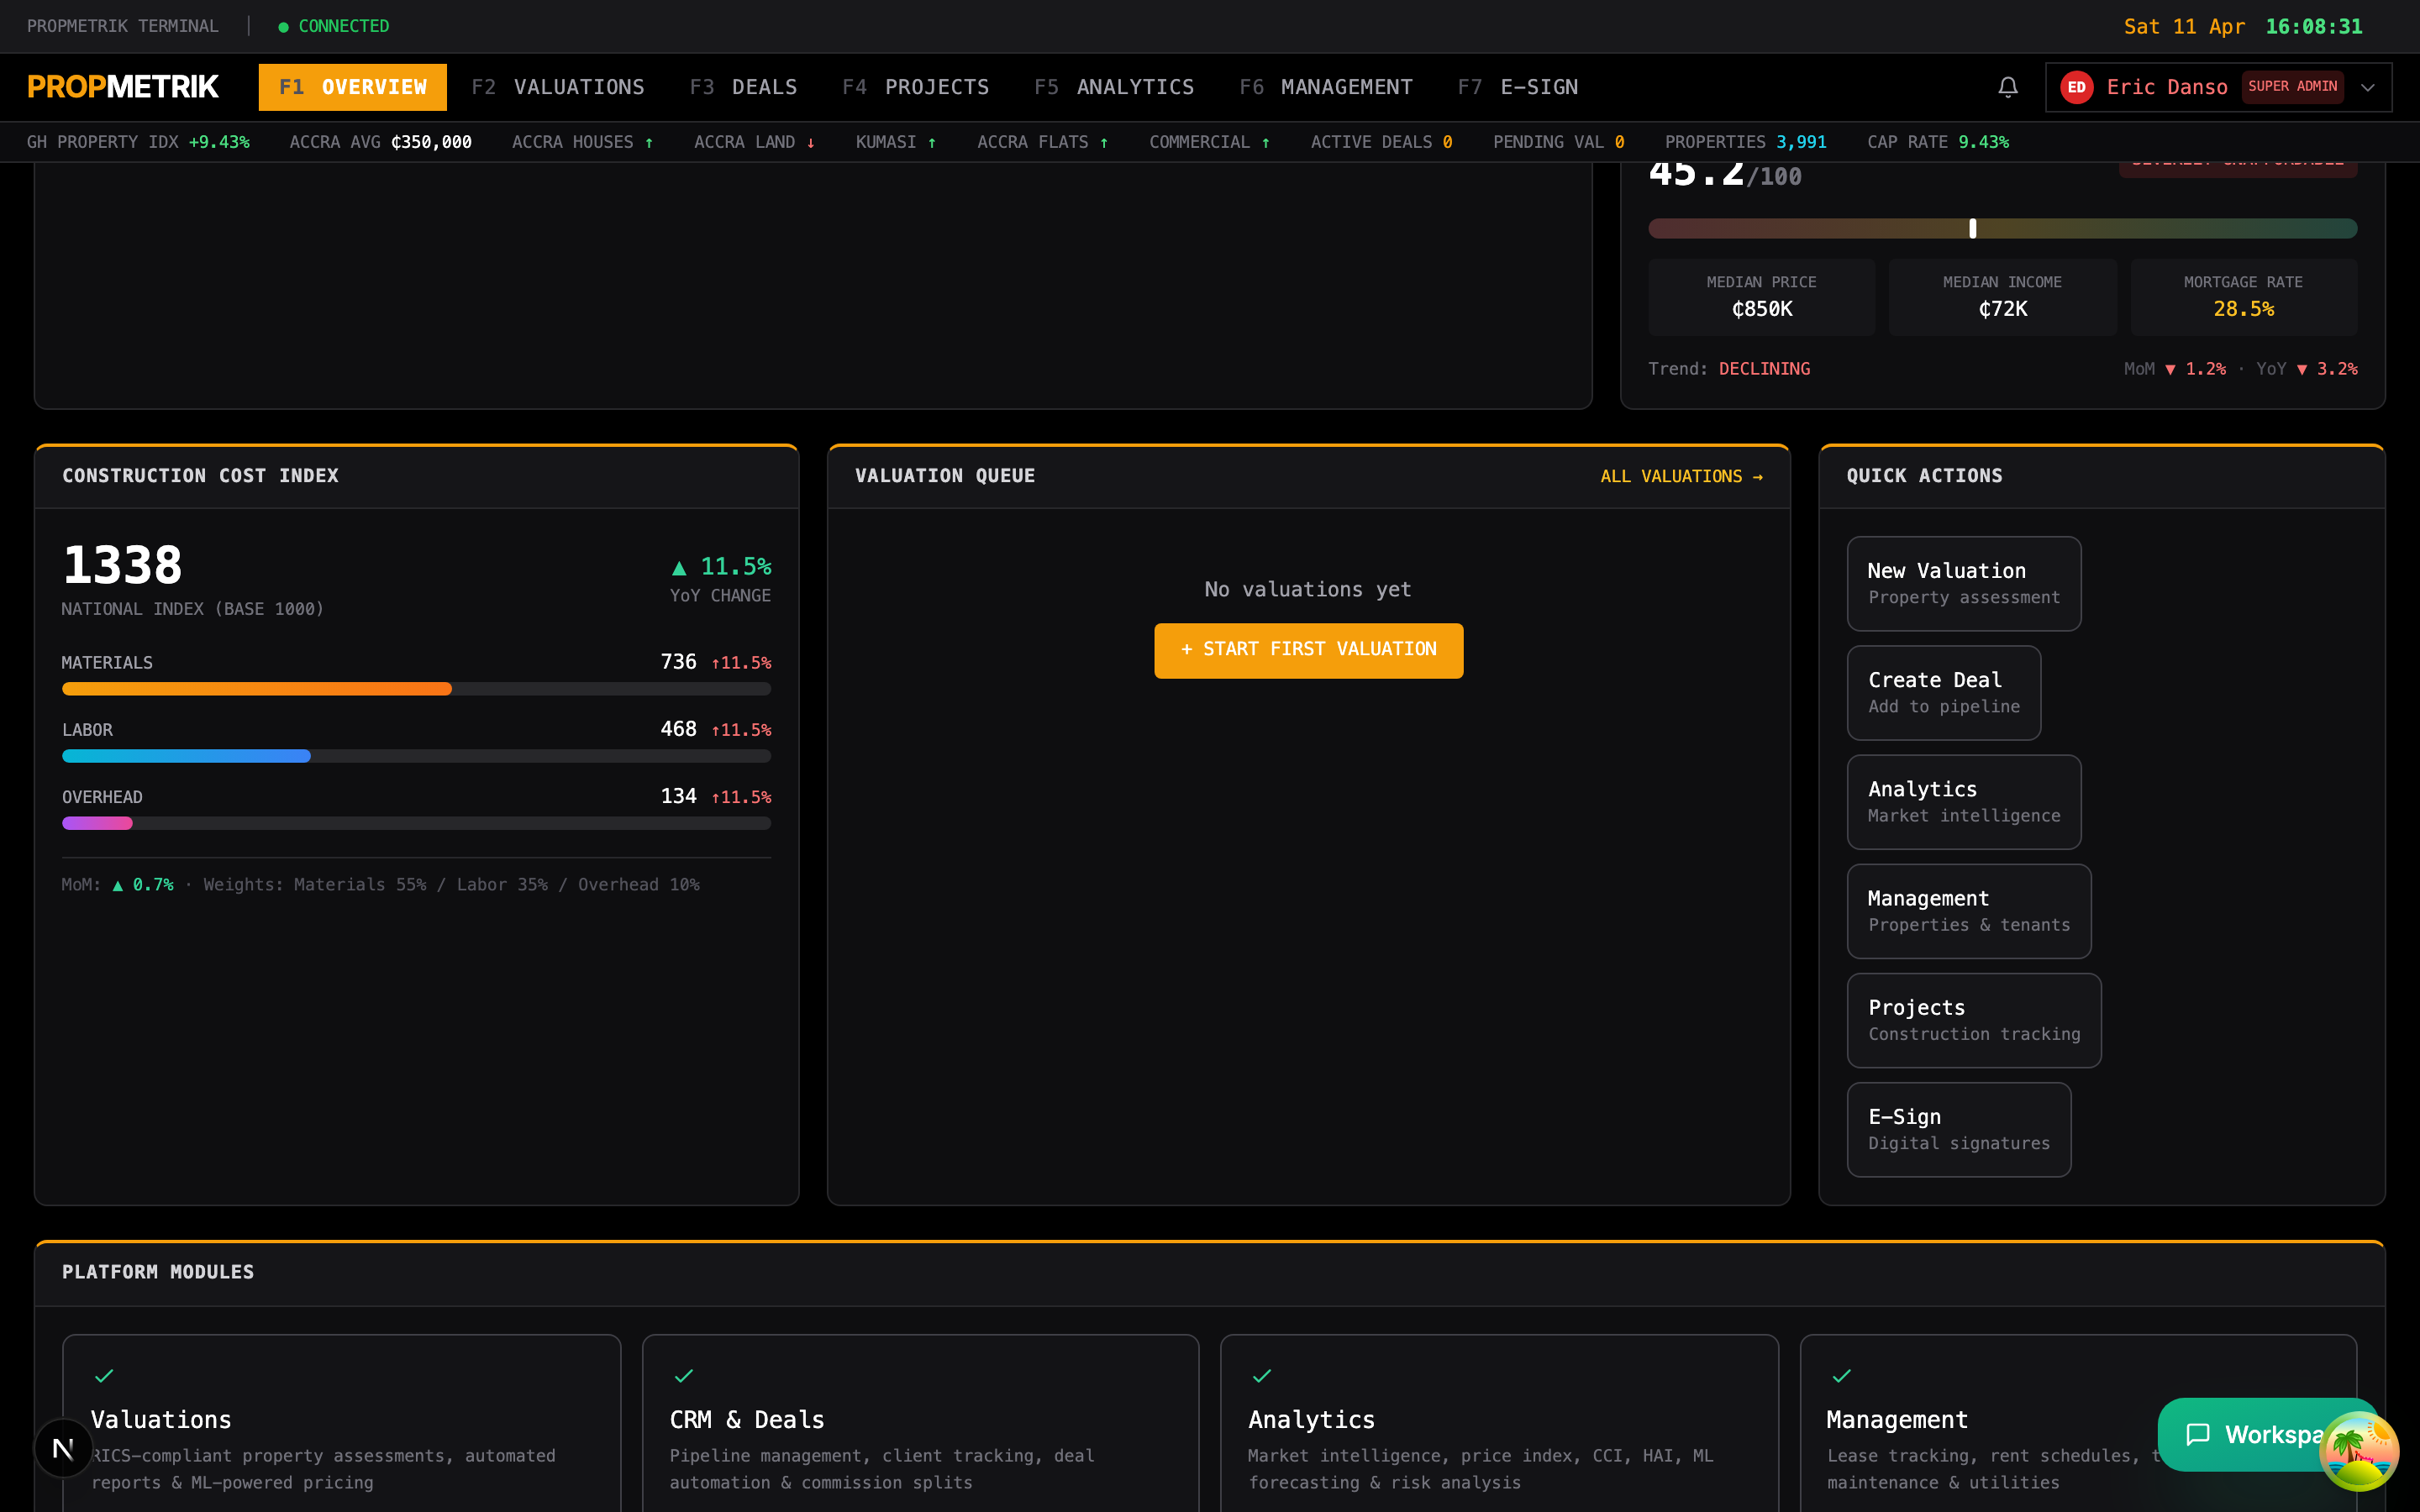
Scrolling further down the dashboard reveals deeper market intelligence panels.
Market Indicators
A table showing key metrics for different areas:
- Area -- Geographic region or neighborhood
- Average Price -- Current average property price in the area
- Volume -- Number of transactions recorded
- Change -- Percentage change over the reporting period (positive values in green, negative in red)
Construction Cost Index (CCI)
Displays the national Construction Cost Index with its three components:
- Materials -- Cost index for building materials with month-over-month and year-over-year changes
- Labor -- Cost index for construction labor
- Overhead -- Cost index for project overhead
Each component shows its weight in the overall index, current value, and recent trends.
Property Management KPIs
If you have properties under management, this panel shows:
- Average cap rate across your portfolio
- Average monthly rent
- Average annual net operating income (NOI)
- Average gross yield
- Total rental vs. sale properties
2.3 Dashboard Bottom Section
The lower portion of the dashboard contains additional intelligence and action items.
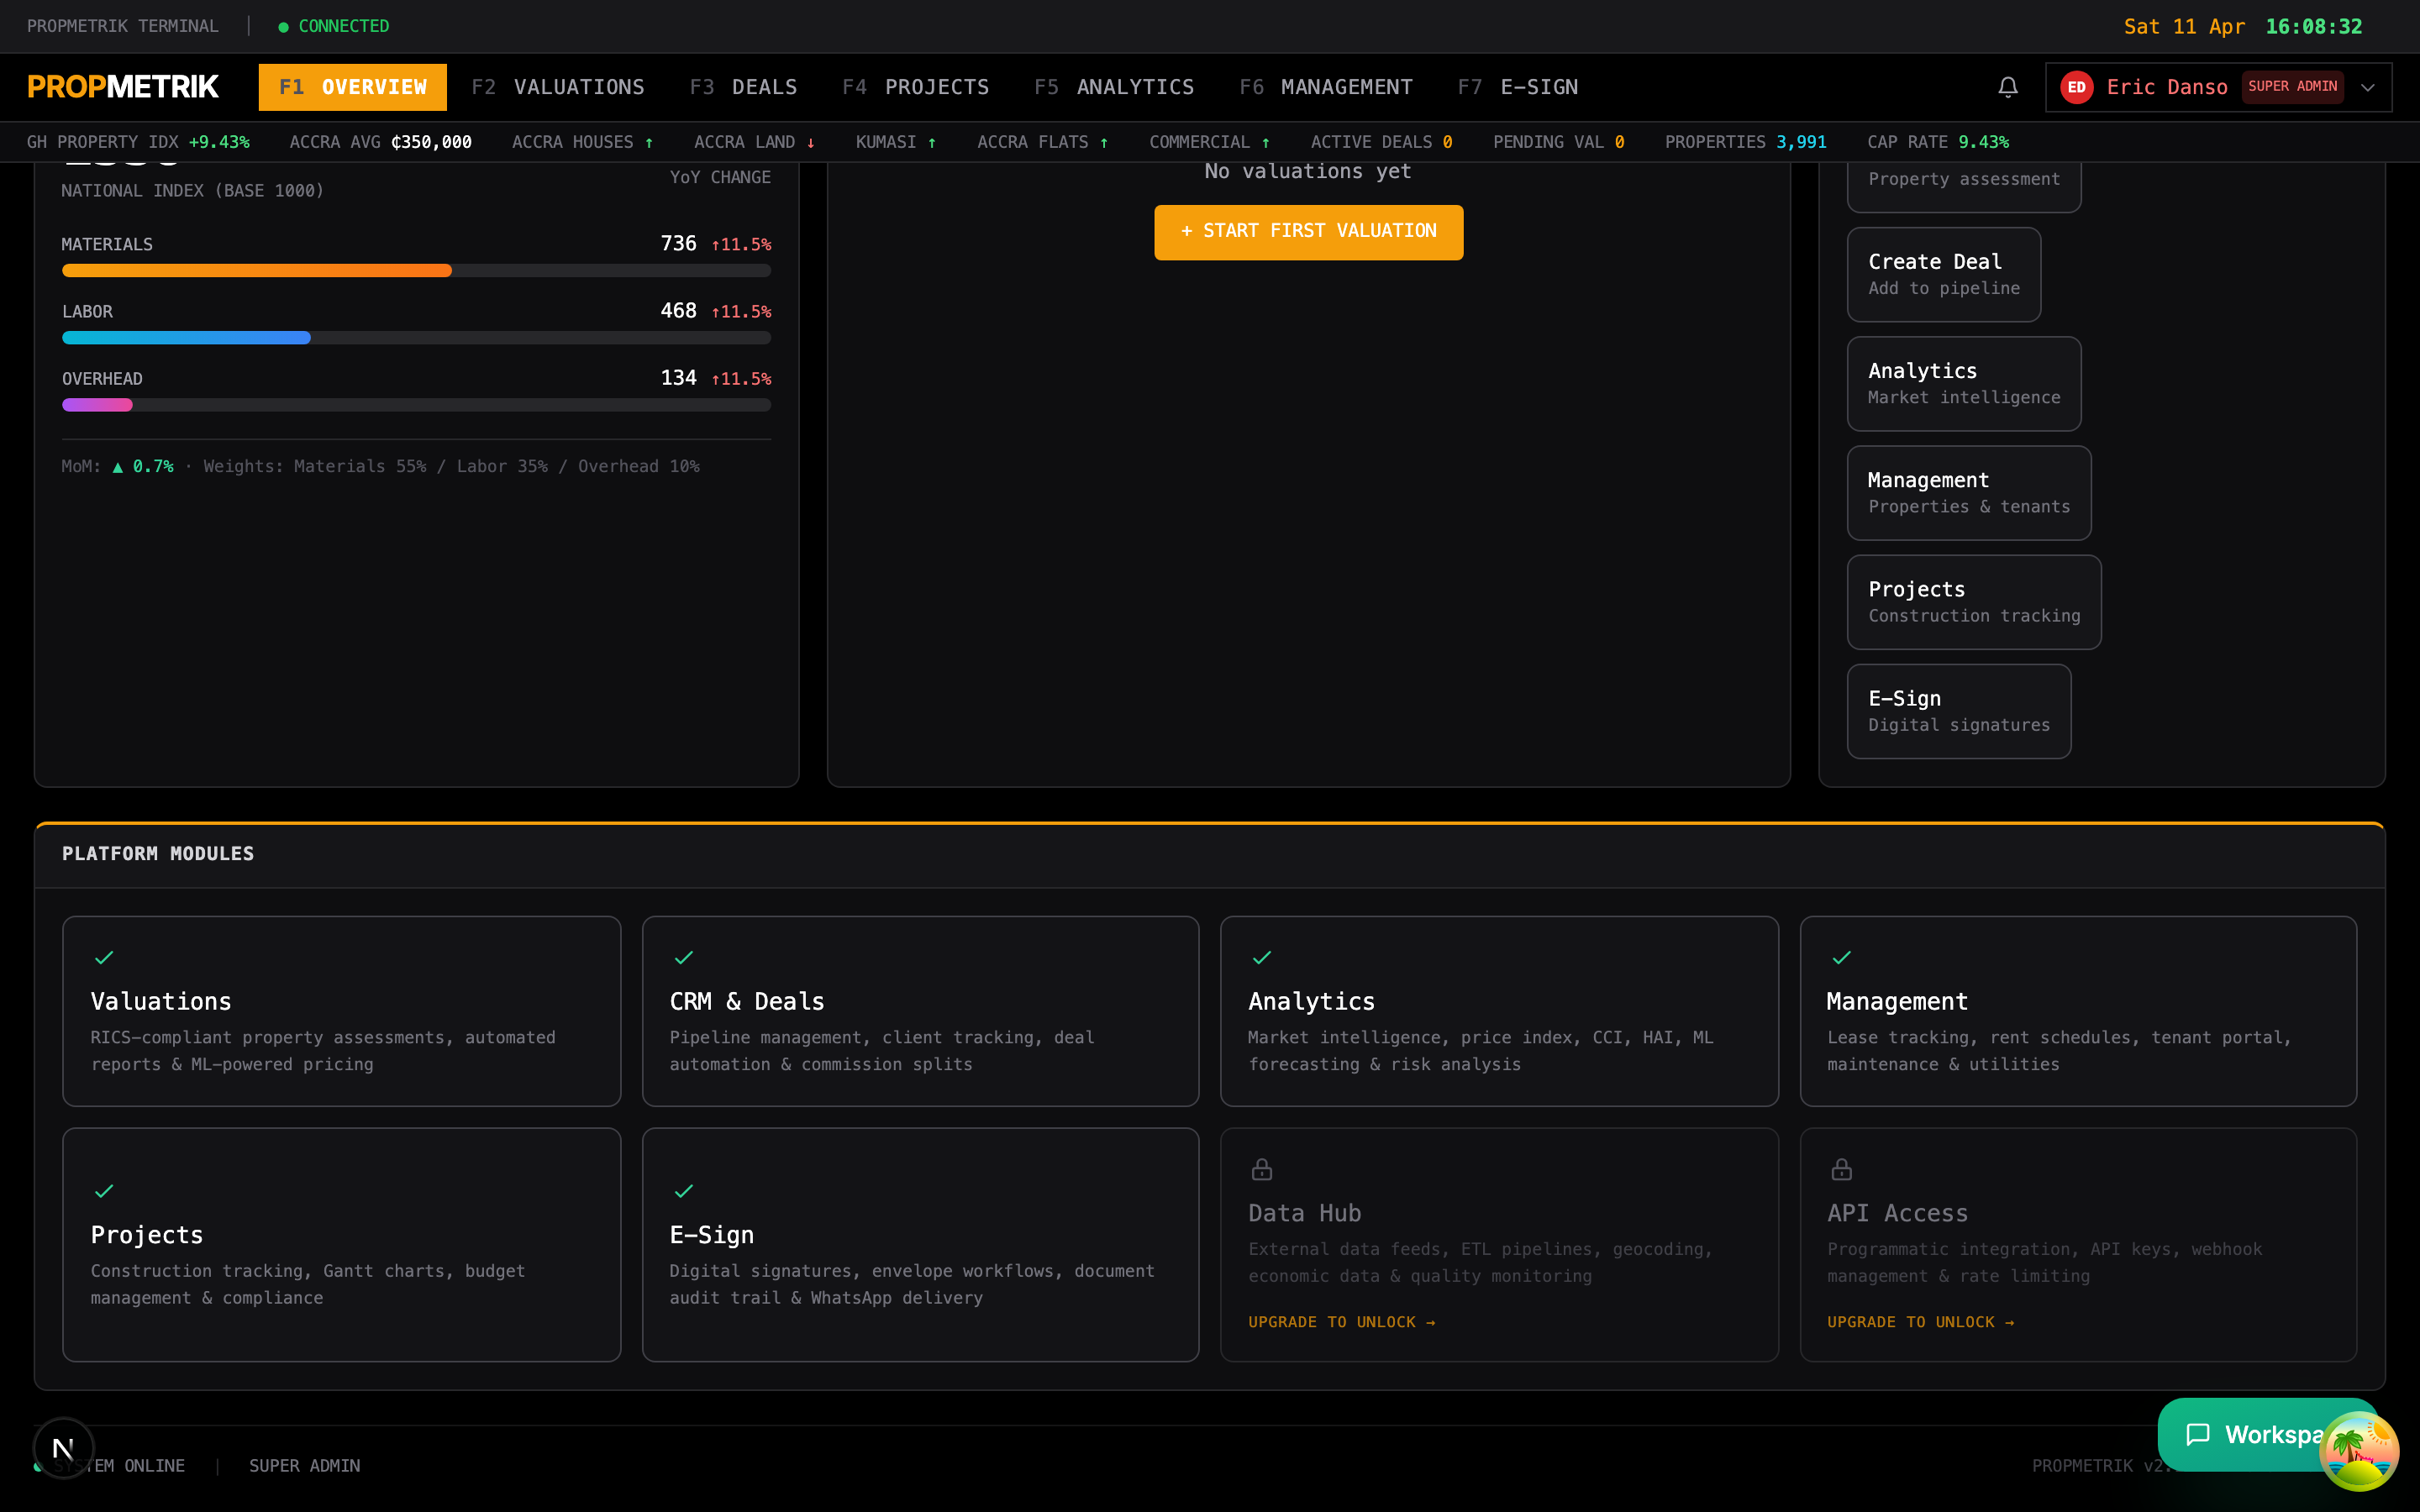
Market Price Index
A breakdown of median and average property prices by region and property type. This data comes from PROPMETRIK's Data Hub and is updated regularly.
Quick Actions
Shortcut buttons for common tasks:
- Create a new valuation
- Start a new deal
- Add a property
- Create a project
- View reports
2.4 Navigation Sidebar
The left sidebar provides access to all PROPMETRIK modules. It collapses to icons on smaller screens and expands on hover or click.
Module Navigation
| Icon | Module | Description |
|---|---|---|
| Dashboard | Home | Return to the main dashboard |
| Projects | Project Management | Construction project lifecycle management |
| Properties | Property Management | Portfolio, buildings, units, and leases |
| Valuations | Valuations | Property valuations and reports |
| Deals | CRM & Deals | Deal pipeline, contacts, and transactions |
| E-Sign | E-Signatures | Digital document signing |
| Calendar | Calendar | Unified calendar for milestones and deadlines |
| Analytics | Analytics | Market analytics and insights |
| Admin | Administration | Organization settings and compliance |
Tip: Use keyboard shortcuts to navigate quickly between modules. Press
?on any page to see available shortcuts.
2.5 Your Profile
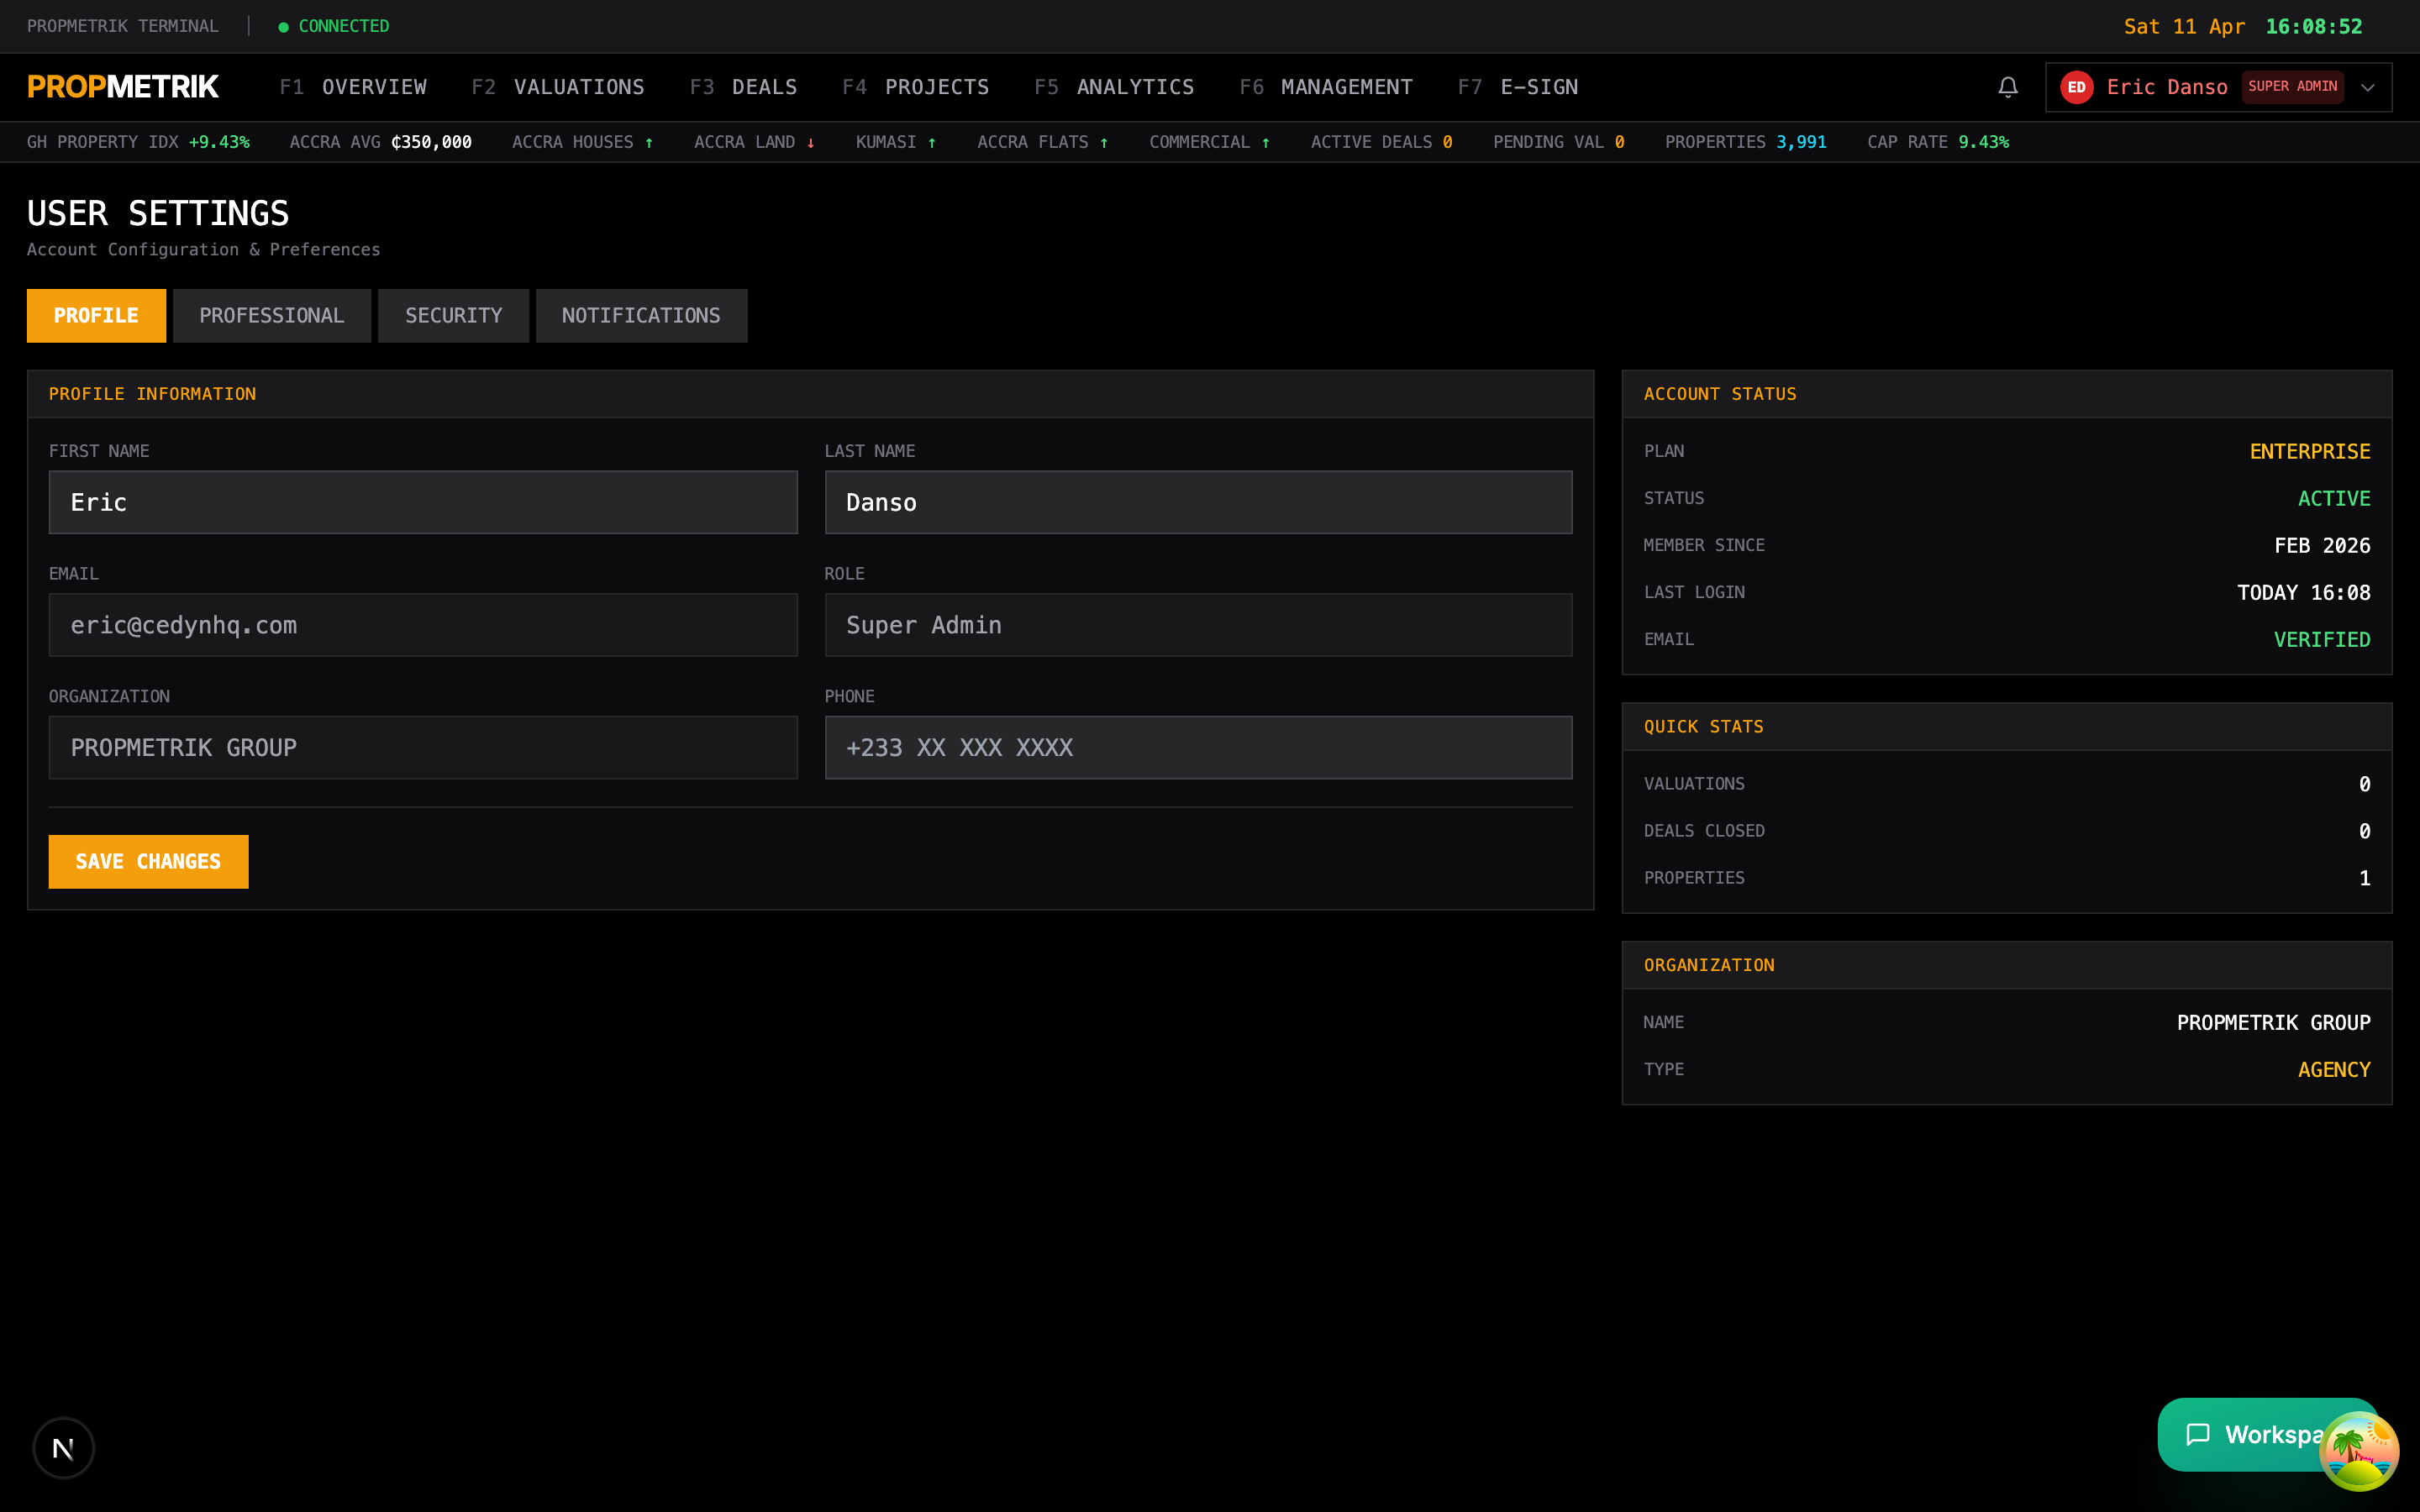
Access your profile by clicking your avatar or name in the top-right corner of the dashboard.
Profile Settings
From the profile page you can:
-
Update Personal Information
- Edit your full name, phone number, and job title.
- Upload or change your profile photo.
-
Change Password
- Enter your current password and set a new one.
- Password must meet minimum complexity requirements.
-
Notification Preferences
- Choose which notifications you receive (email, in-app, WhatsApp).
- Set notification frequency (immediate, daily digest, weekly summary).
-
Connected Accounts
- View linked identity providers (e.g., Google, Microsoft).
- Manage SSO connections.
-
API Access
- View your API key for programmatic access (available on Developer and Enterprise plans).
- Regenerate your API key if compromised.
How to Update Your Profile
- Click your avatar in the top-right corner.
- Select Profile from the dropdown menu.
- Edit the fields you want to update.
- Click Save Changes.
2.6 Notifications
PROPMETRIK keeps you informed with a real-time notification system.
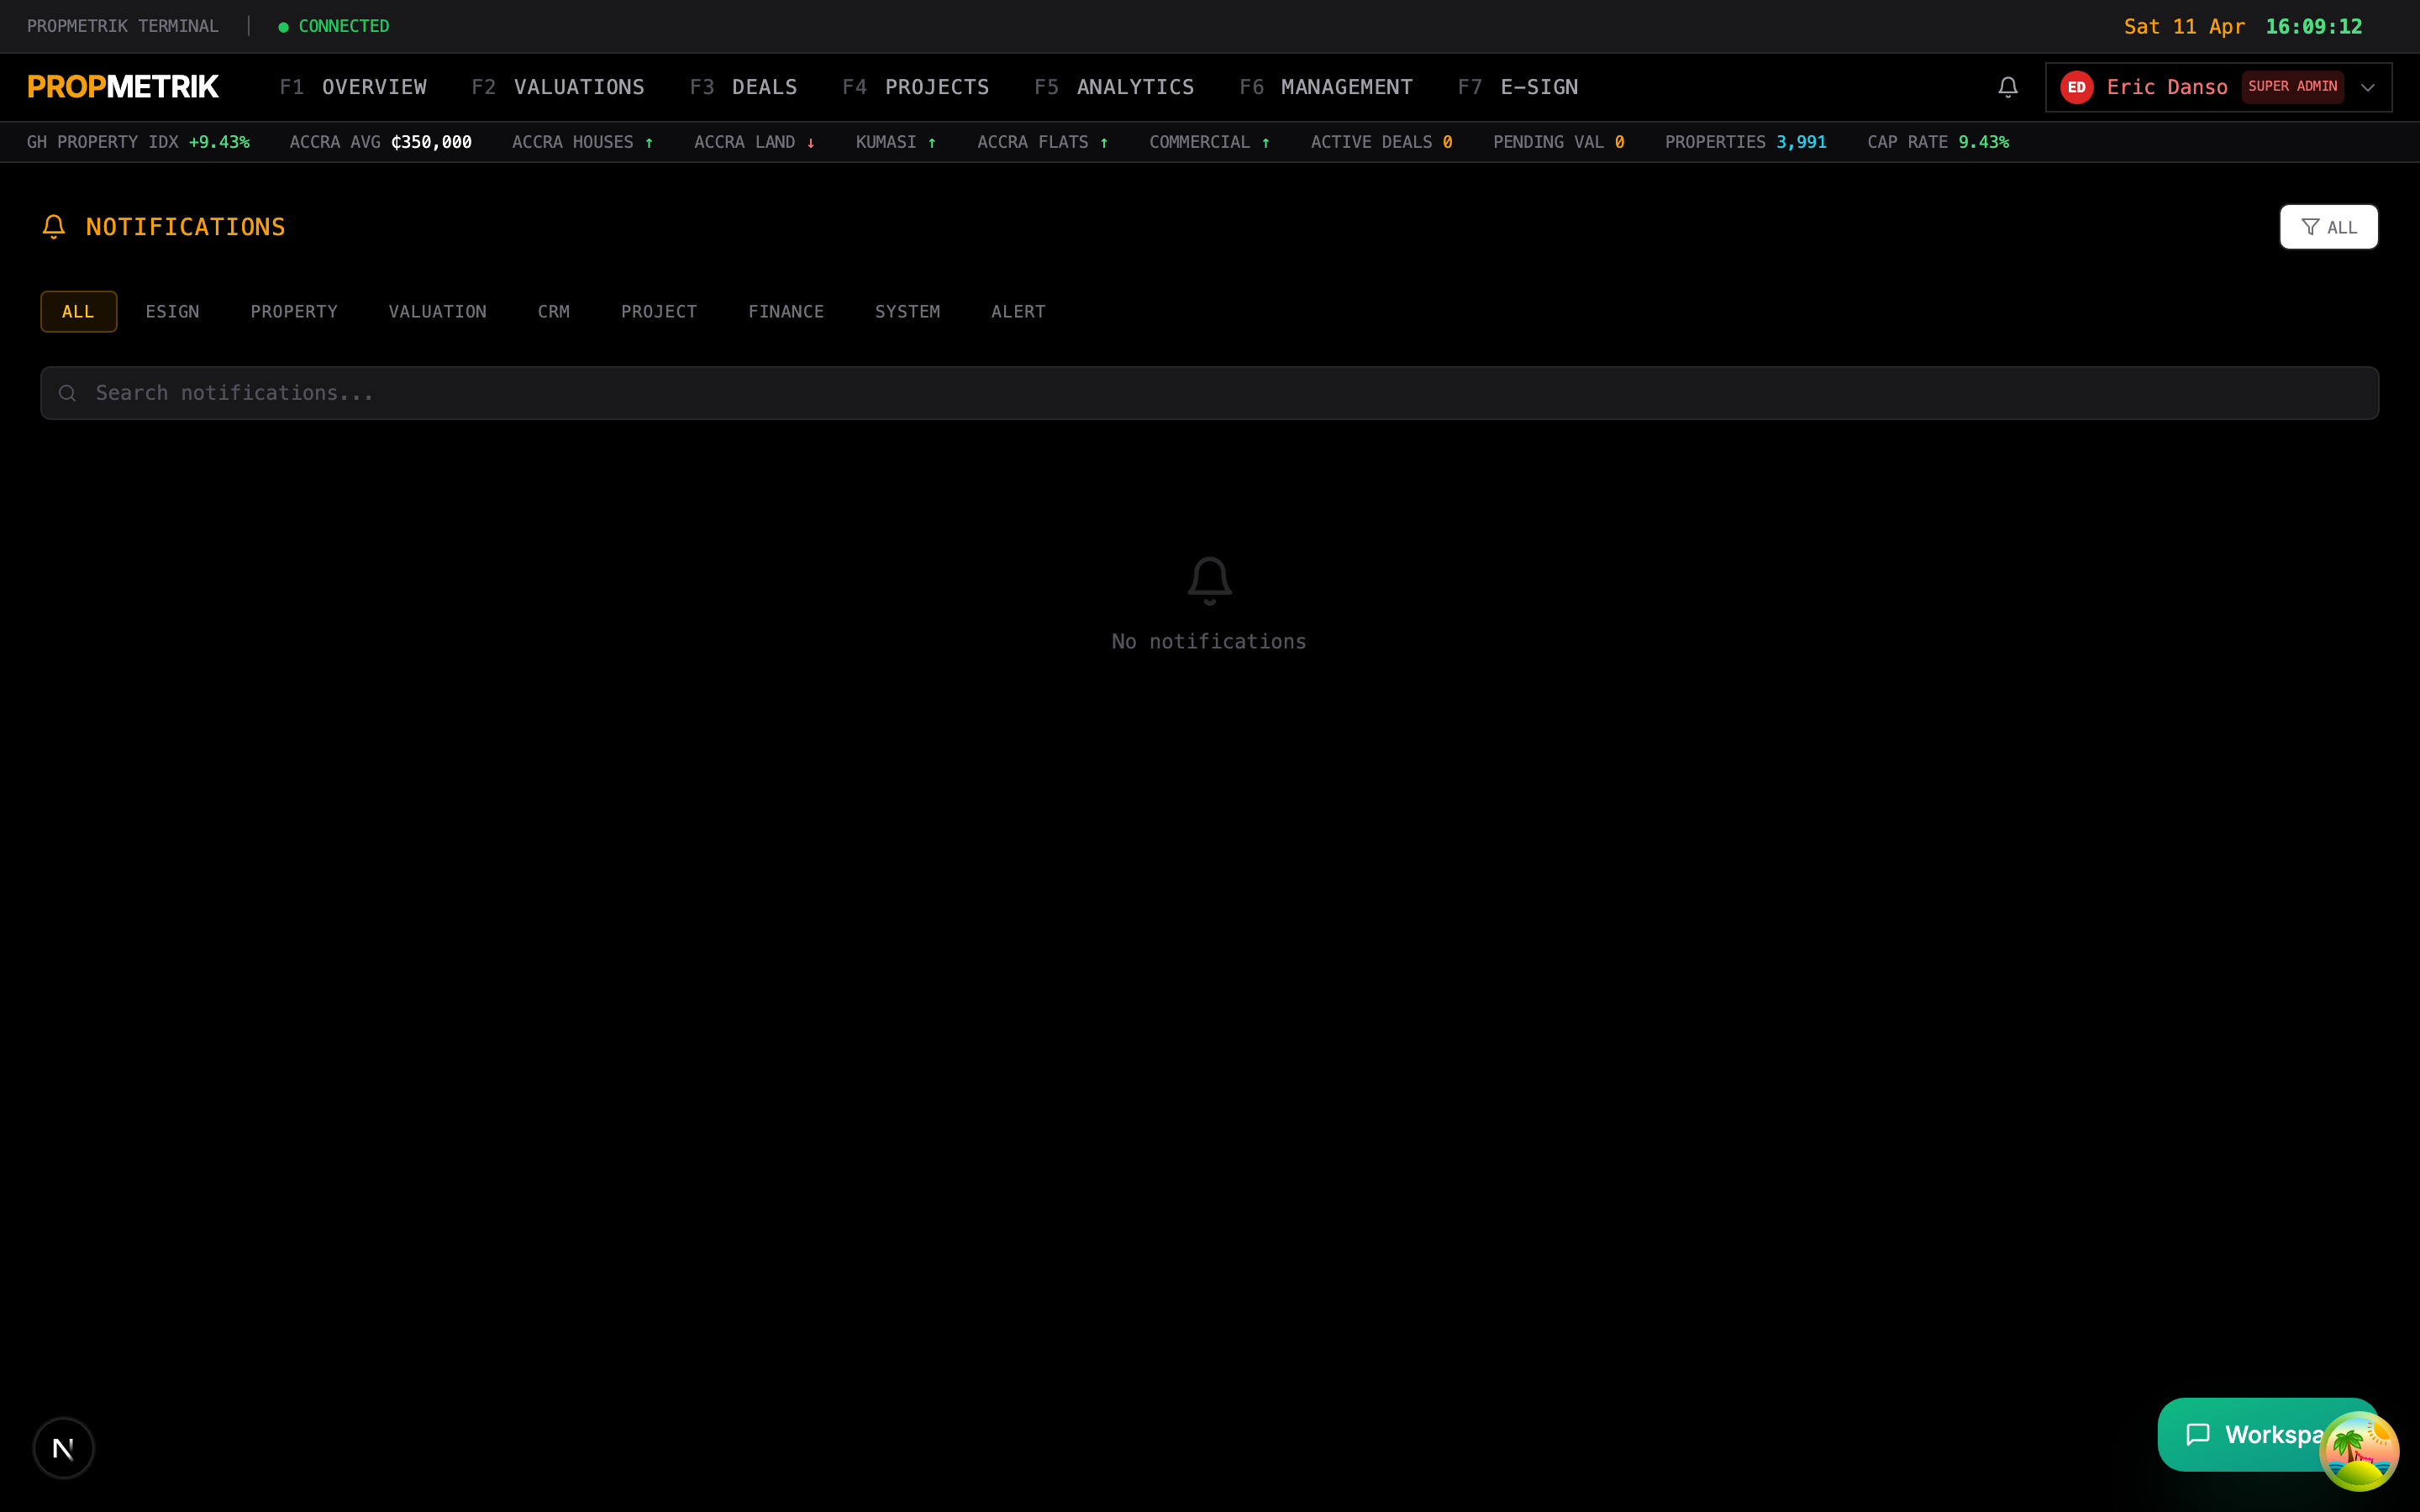
Notification Types
- Valuation Updates -- When a valuation you requested is completed or requires action.
- Deal Activity -- When a deal moves to a new pipeline stage or a contact responds.
- Project Alerts -- Milestone deadlines, budget overruns, RFI responses, and inspection results.
- Property Management -- Lease expirations, maintenance requests, and payment receipts.
- Team -- Invitation acceptances, role changes, and mentions.
- System -- Platform updates, scheduled maintenance, and security alerts.
Managing Notifications
- Click the bell icon in the top navigation bar to open the notification panel.
- Unread notifications appear with a badge count on the bell icon.
- Click any notification to navigate directly to the relevant item.
- Use the Mark All Read button to clear the unread badge.
- Click Settings within the notification panel to customize which notifications you receive.
Tip: For time-sensitive alerts (e.g., safety incidents on construction sites), enable WhatsApp notifications in your profile settings to receive instant messages.
2.7 Calendar
The unified calendar aggregates events from all modules into a single view.
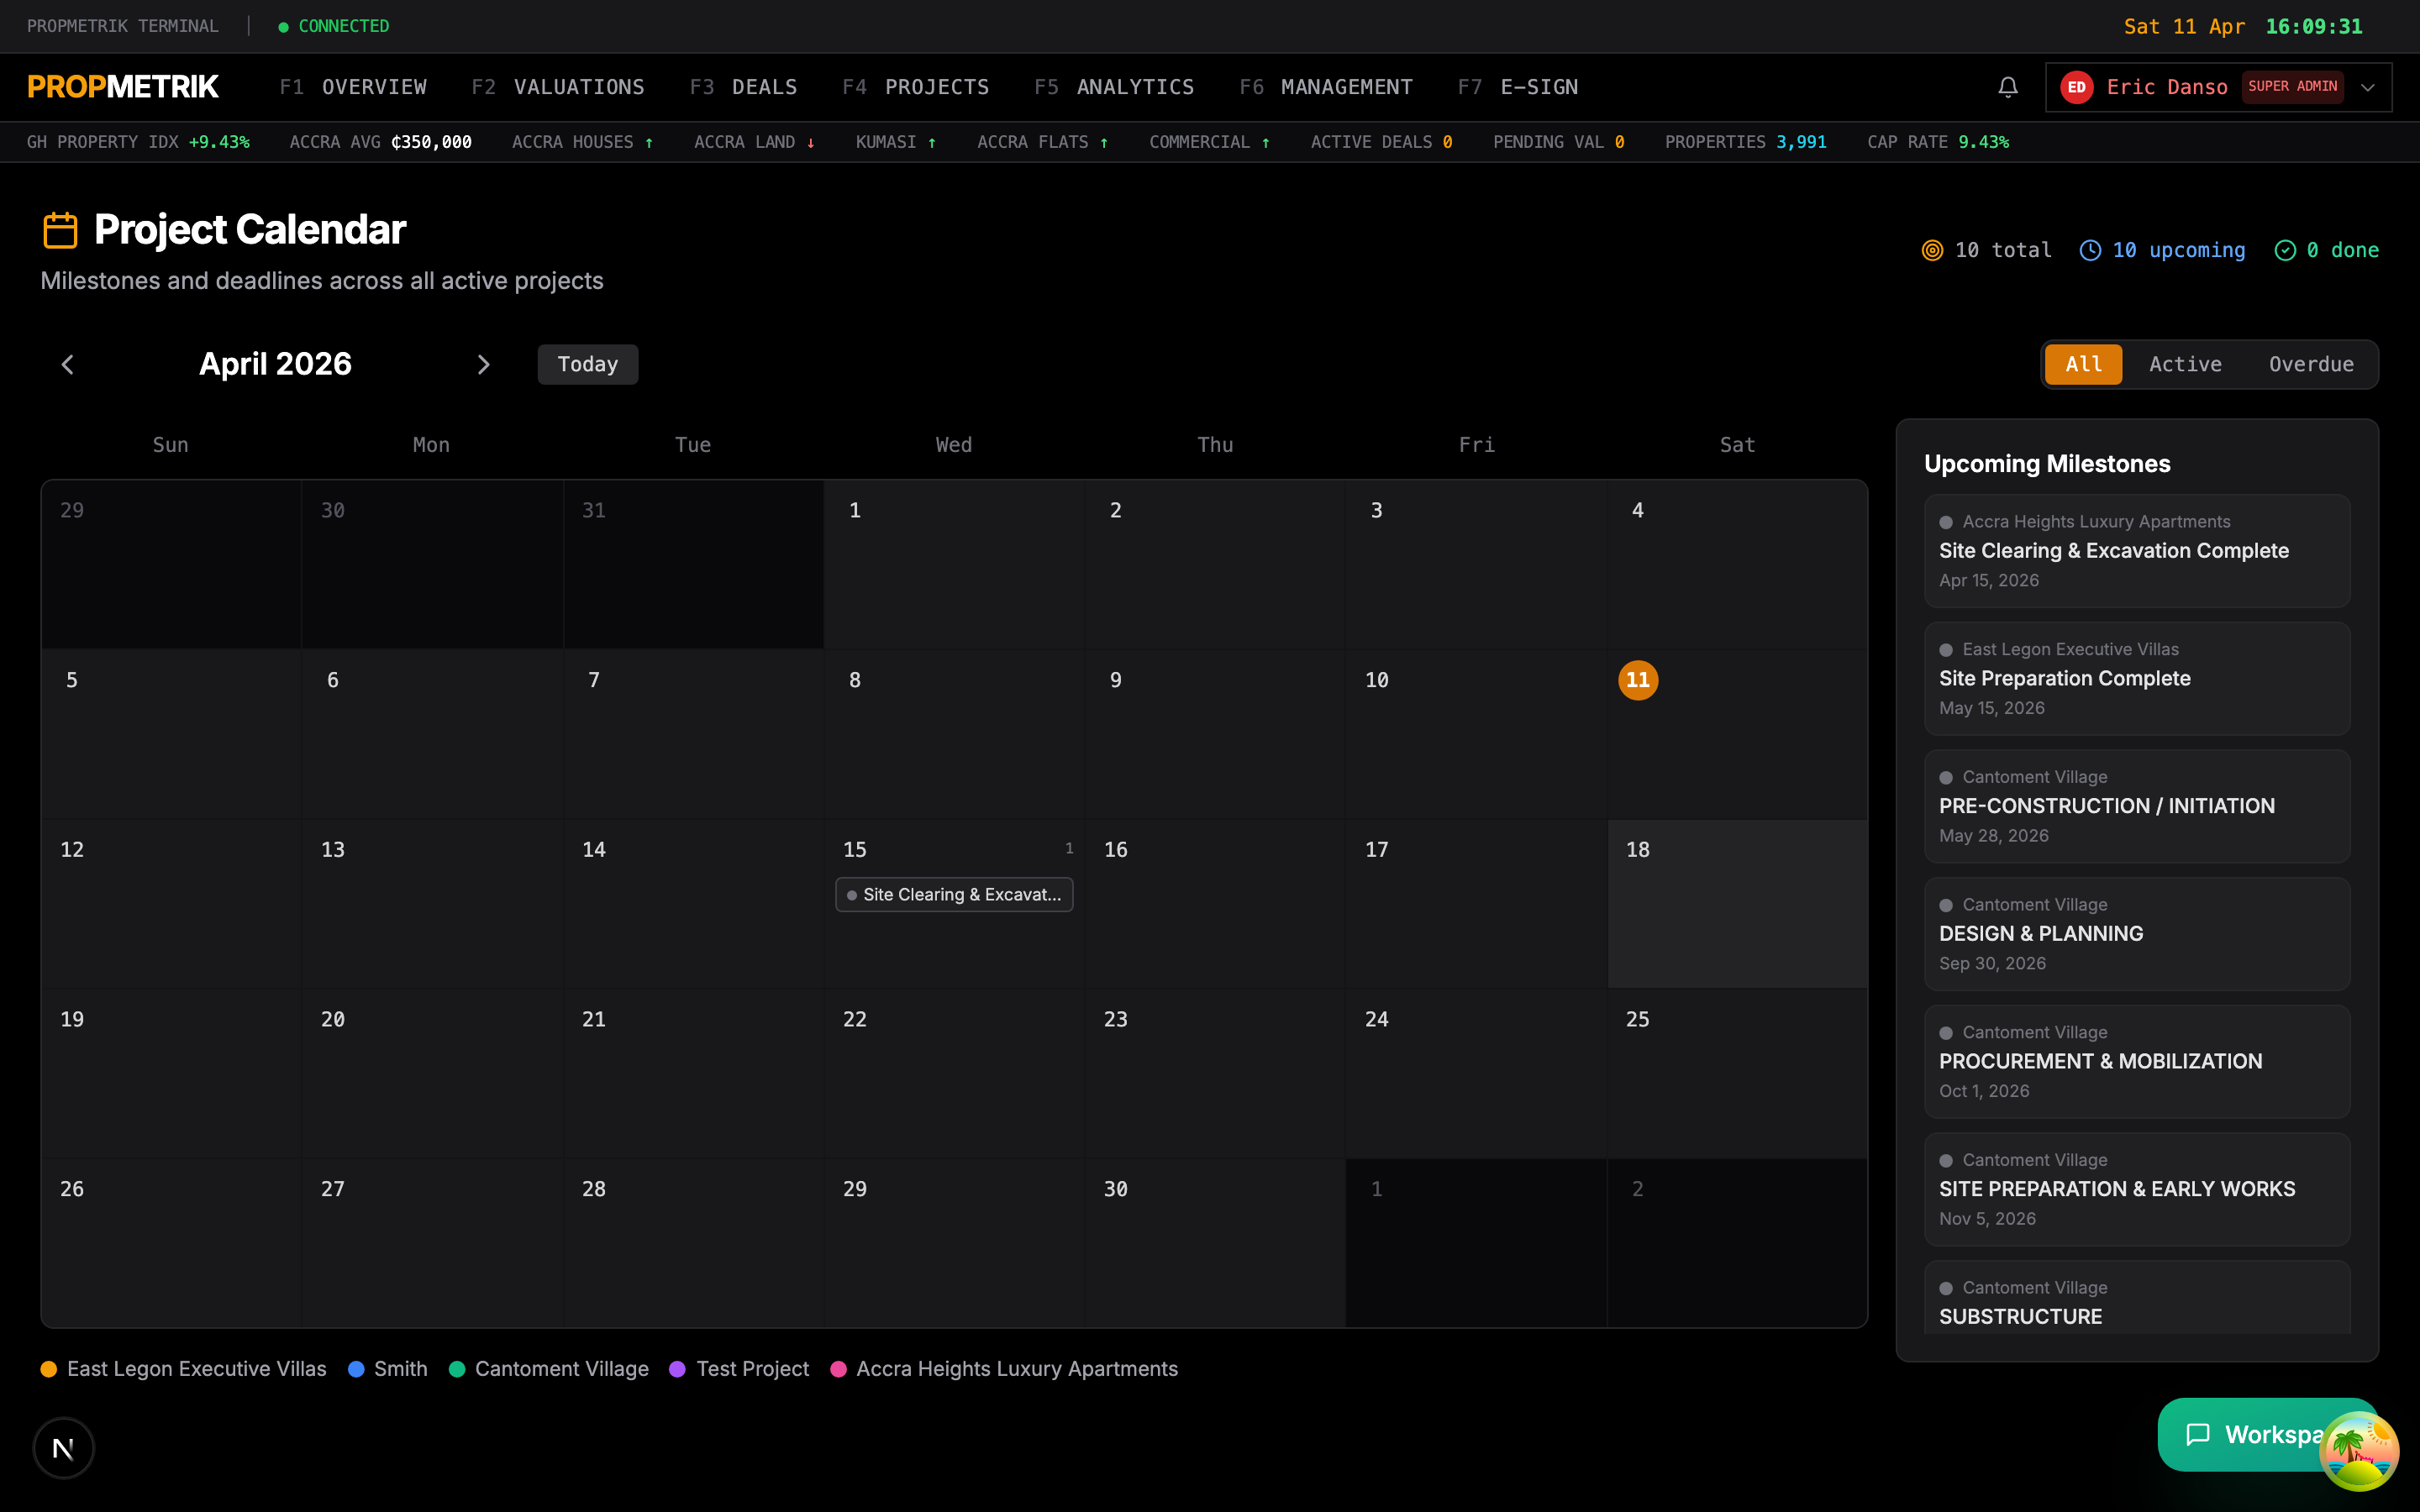
Calendar Features
Views
- Month View -- A traditional grid showing all events for the month. Days with events display colored dots.
- Week View -- A detailed view of the current week with time slots.
- Day View -- Hour-by-hour breakdown of a single day.
Event Types The calendar pulls events from multiple sources, each color-coded:
| Color | Source | Examples |
|---|---|---|
| Amber | Project Milestones | Foundation completion, roofing deadline |
| Blue | Deal Events | Viewing appointments, offer deadlines |
| Green | Property Management | Lease start/end dates, inspection schedules |
| Red | Overdue Items | Missed deadlines, overdue payments |
| Purple | Meetings | Team meetings, stakeholder reviews |
Using the Calendar
- Navigate to Calendar from the sidebar.
- Use the left/right arrows to move between months.
- Click any date to see all events for that day in a detail panel.
- Click an event to navigate to the source item (e.g., clicking a milestone opens the project schedule).
- Use the filter button to show/hide specific event types or projects.
Filtering Events
- Click the Filter icon at the top of the calendar.
- Select which projects you want to see milestones for.
- Toggle event categories (milestones, deadlines, meetings) on or off.
- The filter persists across sessions until you change it.
2.8 Portfolio Overview
The portfolio view provides a high-level summary of all your real estate assets.
Portfolio Metrics
- Total Portfolio Value -- Sum of all property valuations in your portfolio.
- Properties by Type -- Breakdown of residential, commercial, mixed-use, and industrial properties.
- Geographic Distribution -- Map or list showing where your properties are located across Ghana.
- Performance Indicators -- Aggregate yield, occupancy rate, and NOI across the portfolio.
How to Use the Portfolio View
- Navigate to the Portfolio section from the dashboard or sidebar.
- Review the summary cards at the top for overall metrics.
- Use the property list below to see individual assets with their current valuation, status, and key metrics.
- Click any property to drill into its detail page.
- Use filters to narrow by property type, location, or status.
Tip: The portfolio view is ideal for investor reports. You can export portfolio summaries as PDF or Excel from the actions menu.
2.9 Dashboard Customization Tips
Personalizing Your Experience
- Role-based views: The dashboard automatically adjusts its panels based on your role. Valuers see the valuation queue prominently; project managers see project milestones; property managers see occupancy metrics.
- Plan-based access: Some dashboard panels display a lock icon if they require a higher-tier plan. Click the lock to see upgrade options.
- Refresh data: The dashboard data refreshes automatically via real-time connections. You can also manually refresh by pressing
Ctrl+R(orCmd+Ron Mac).
Quick Navigation
| Action | How |
|---|---|
| Return to dashboard | Click the PROPMETRIK logo or "Dashboard" in the sidebar |
| Open notifications | Click the bell icon |
| Open profile | Click your avatar |
| Open calendar | Click "Calendar" in the sidebar |
| Search | Use the search bar in the top navigation |
Summary
| Feature | Location |
|---|---|
| Market ticker | Top of main dashboard |
| Overview statistics | Dashboard summary cards |
| Deal pipeline | Dashboard middle section |
| Market intelligence | Dashboard scroll-down panels |
| Profile settings | Avatar > Profile |
| Notifications | Bell icon (top-right) |
| Calendar | Sidebar > Calendar |
| Portfolio | Sidebar > Portfolio |
Previous: Chapter 1 -- Authentication & Onboarding | Next: Chapter 3 -- Project Management