
Reporting & Analytics
Project and property management reports, valuation, deal, team and CRM analytics, leaderboards, and sensitivity analysis.
Chapter 14: Reporting & Analytics
PROPMETRIK provides a comprehensive reporting suite that spans every module on the platform. From project-level compliance reports to cross-portfolio valuation analytics and sensitivity modeling, this chapter covers how to generate, interpret, and export reports across the platform.
14.1 Project Reports
Generate and manage construction project reports at Dashboard > Projects > [Project] > Reports, or view aggregated reports at Dashboard > Analytics.

Available Project Report Types
| Report | Description |
|---|---|
| Progress Report | Summarizes construction progress by phase, including percentage complete, milestones hit, and schedule variance |
| Cost Report | Breaks down actual vs. budgeted costs by cost code, with variance analysis and forecasting |
| Safety Report | Compiles safety inspection results, incident counts, and compliance scores |
| Quality Report | Aggregates checklist inspection scores, punch list status, and deficiency trends |
| Meeting Minutes | Formatted record of project meetings with action items and attendee lists |
| Change Order Summary | Lists all approved, pending, and rejected change orders with cost impact |
| Closeout Report | Final project summary covering schedule performance, budget adherence, and lessons learned |
Generating a Project Report
- Navigate to the project and click the Reports tab.
- Select the report type from the template gallery.
- Configure report parameters:
- Date range -- The reporting period (e.g., this month, this quarter, project-to-date).
- Sections -- Toggle which sections to include or exclude.
- Format -- Choose PDF, Excel, or on-screen preview.
- Click Generate Report.
- The report appears in the report list with a download link. Click to view or download.
Scheduling Automated Reports
- On the Reports tab, click Schedule.
- Choose the report type and frequency (daily, weekly, biweekly, monthly).
- Set the delivery method:
- Email -- Enter recipient email addresses.
- In-app -- Report appears in the notifications center.
- WhatsApp -- Summary sent via the WhatsApp bot to specified numbers.
- Click Save Schedule. Reports generate automatically at the configured interval.
E-Signing Reports
Project reports that require stakeholder approval can be routed through the e-sign workflow:
- After generating a report, click Send for Signature.
- Select recipients (project owner, client, compliance officer).
- The report is wrapped in an e-sign envelope and sent via email with a magic link.
- Track signing status directly from the Reports tab.
Tip: Schedule weekly progress reports to auto-generate every Friday. This creates a consistent paper trail for stakeholders and reduces manual reporting effort.
14.2 PM Reports (Project Management Reports)
Access project management analytics and compliance reports at Dashboard > Analytics > PM Reports.
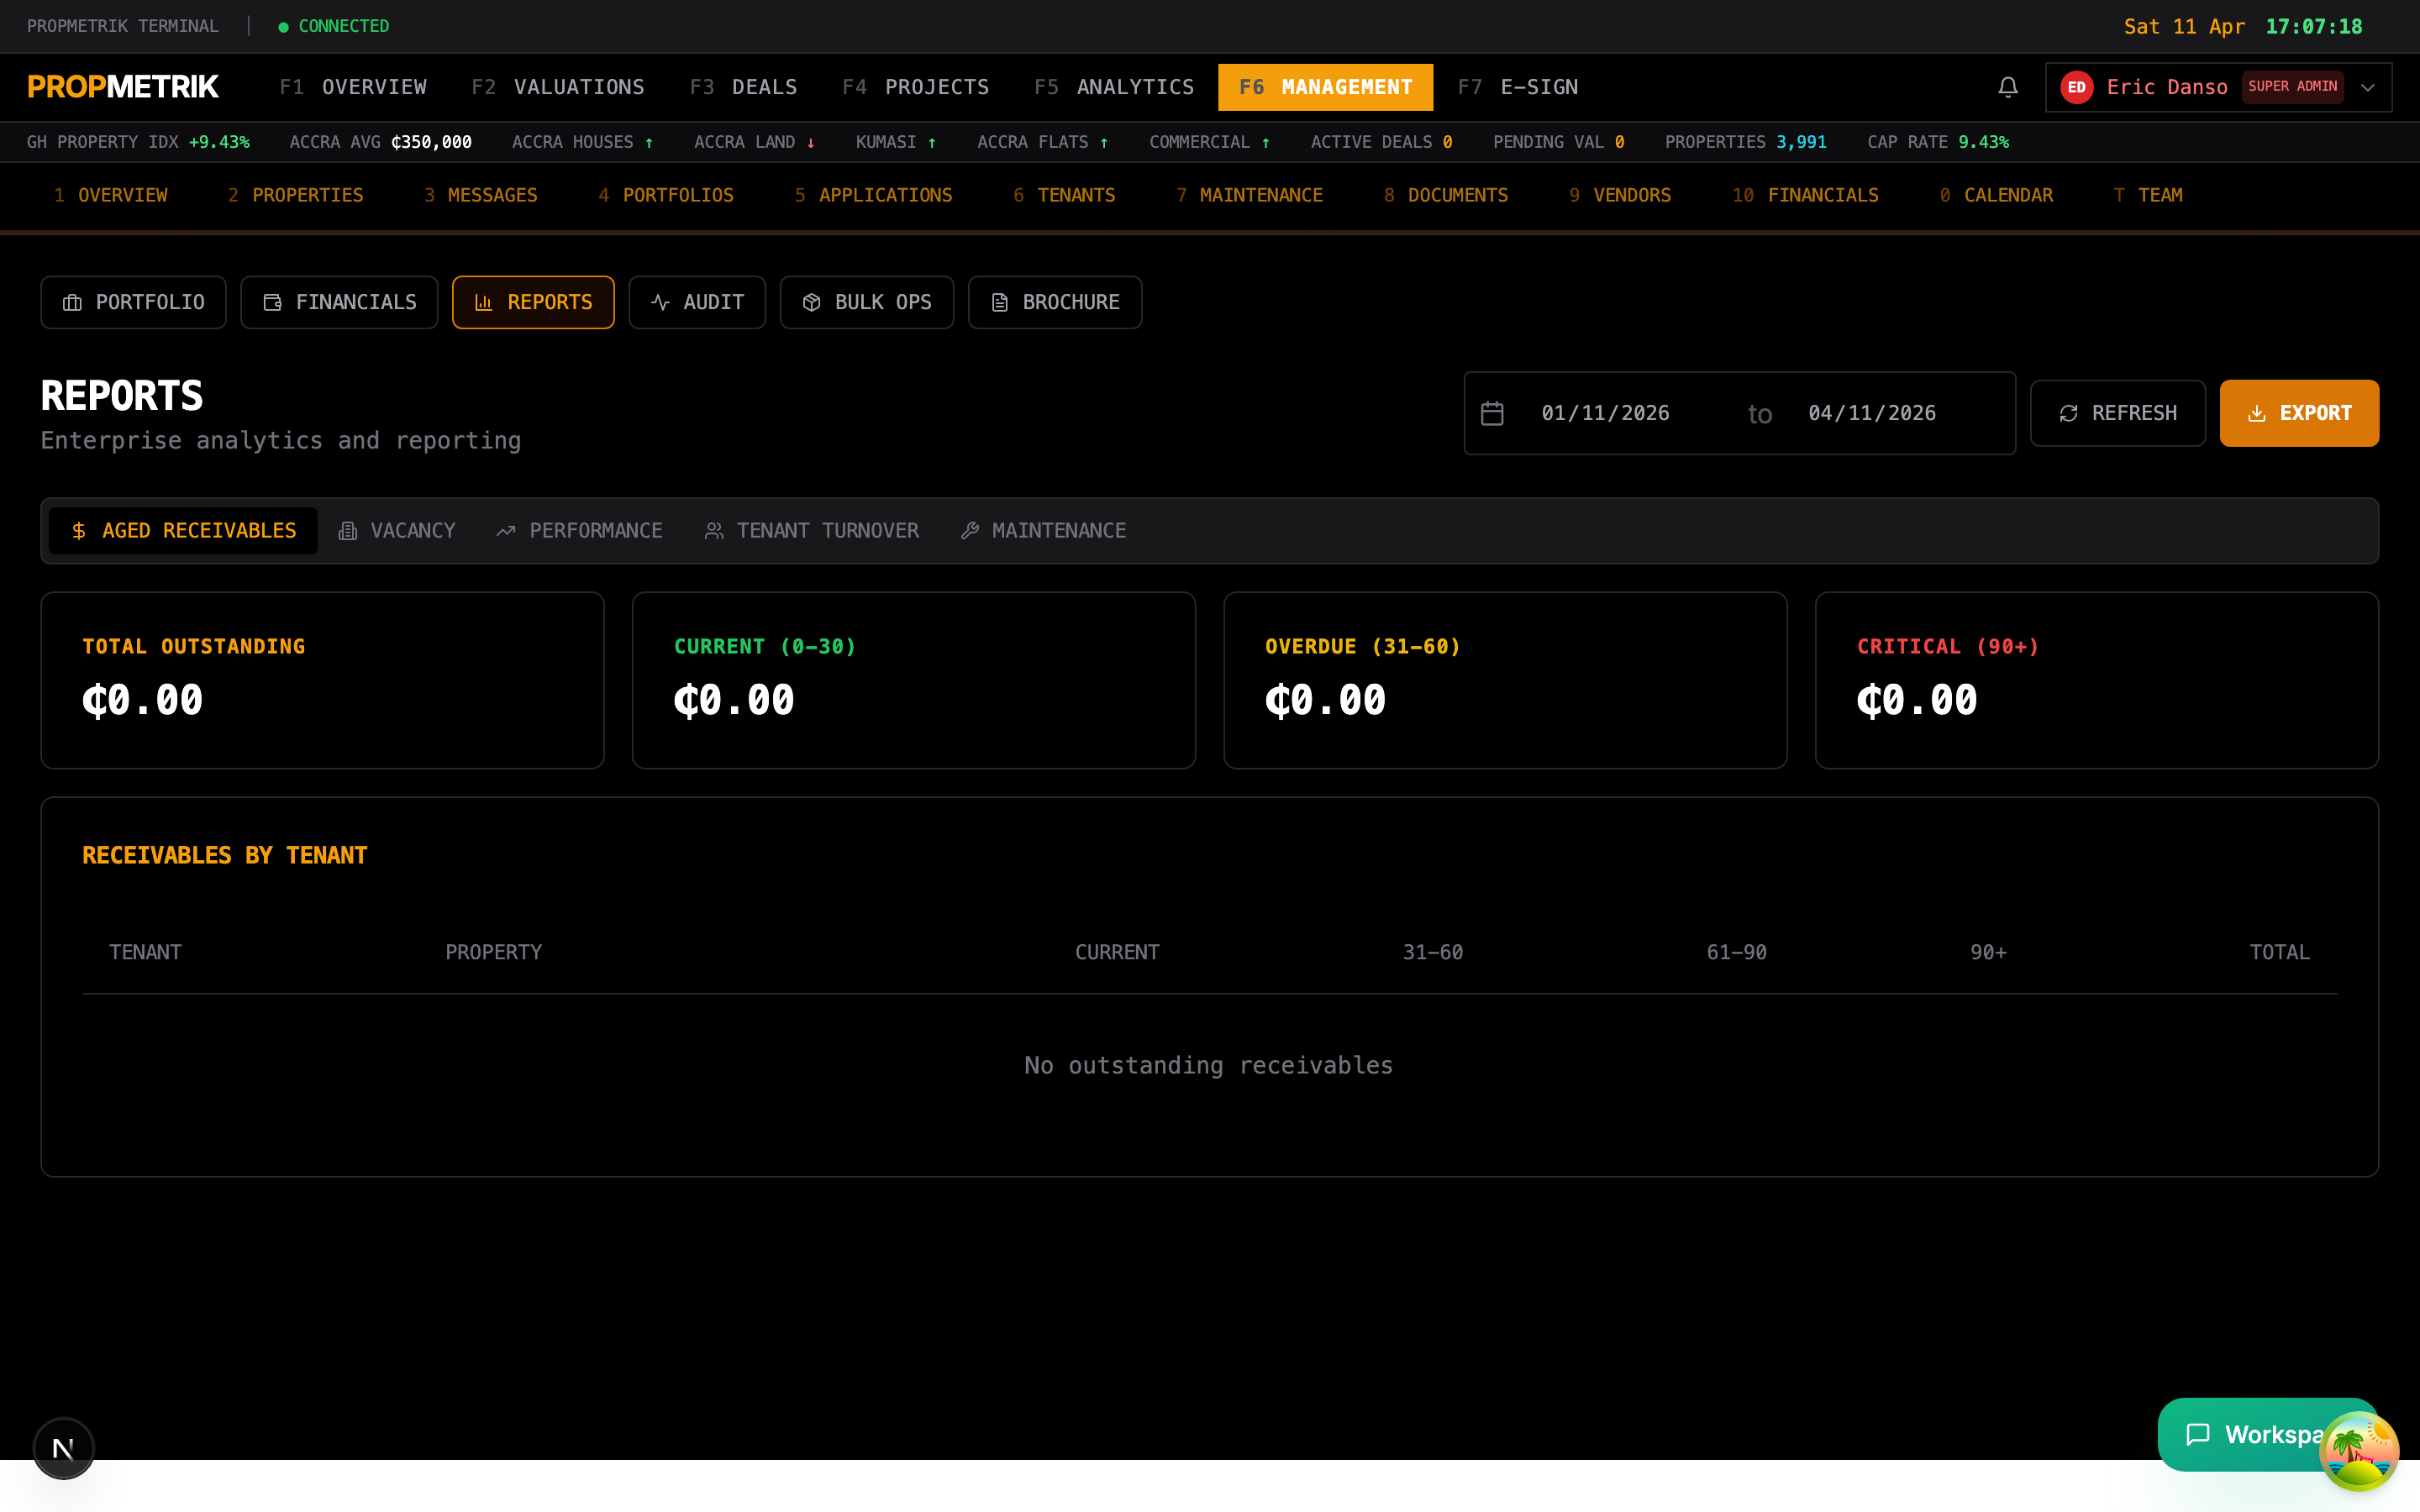
Compliance Report Dashboard
The PM reports page provides a compliance-focused view across all active projects:
- Overall Compliance Score -- A weighted average of safety, quality, documentation, and schedule adherence scores across all projects.
- Project Health Matrix -- A grid showing each project's status across multiple compliance dimensions (red/amber/green).
- Overdue Items -- Count of overdue RFIs, submittals, inspections, and action items.
- Non-Conformance Tracker -- Lists open non-conformance reports (NCRs) with severity ratings.
Generating Compliance Reports
- Select the report scope (single project, portfolio, or organization-wide).
- Choose the compliance framework (internal standards, building code requirements, or client-specific requirements).
- Set the reporting period.
- Click Generate. The report includes:
- Executive summary with overall compliance score
- Section-by-section breakdown (safety, quality, documentation, schedule)
- Charts showing compliance trends over time
- Detailed findings with photos and inspector notes
- Recommended corrective actions
Exporting PM Reports
- PDF -- Formatted report suitable for client distribution and regulatory submission.
- Excel -- Raw data export with all metrics and underlying data points.
- API -- Programmatic access to report data via the PROPMETRIK REST API.
14.3 Valuation Analytics
Access valuation performance analytics at Dashboard > Analytics > Valuations.
Key Metrics
The valuation analytics dashboard tracks:
- Total Valuations -- Count of completed valuations with period-over-period comparison.
- Average Turnaround -- Mean time from instruction to report delivery.
- Revenue -- Total valuation fee revenue by period.
- Pipeline Value -- Aggregate market value of properties currently under valuation.
Production Charts
- Valuations by Month -- Bar chart showing monthly production volume.
- Value Distribution -- Histogram of property values across completed valuations.
- By Property Type -- Breakdown by residential, commercial, industrial, and mixed-use.
- By Location -- Geographic distribution of valuations across regions and districts.
- By Method -- Split between income approach, market comparison, and cost approach valuations.
Valuer Performance
Individual valuer metrics are displayed in a ranked table:
- Valuations completed in the selected period
- Average turnaround time per valuer
- Revenue generated per valuer
- Client satisfaction scores (if feedback is collected)
Use the date range selector and filters to drill into specific time periods, property types, or geographic areas.
14.4 Deal Analytics
Track deal pipeline and CRM performance at Dashboard > Analytics > Deals.
Pipeline Overview
- Total Pipeline Value -- Sum of all active deals by stage.
- Deal Count -- Number of deals at each pipeline stage (lead, prospect, negotiation, under contract, closed).
- Conversion Rates -- Percentage of deals that move from one stage to the next.
- Average Deal Size -- Mean transaction value across closed deals.
- Average Days to Close -- Mean time from lead creation to deal closure.
Revenue Analytics
- Closed Revenue -- Total value of deals closed in the selected period.
- Commission Revenue -- Agent commissions earned.
- Revenue by Agent -- Individual agent performance ranking.
- Revenue by Property Type -- Which property categories generate the most deal volume.
Funnel Visualization
The deal funnel chart shows how many leads convert through each stage. Hover over any stage to see:
- Number of deals at that stage
- Total value
- Average time spent in stage
- Drop-off rate to the next stage
Tip: Monitor the drop-off rate between "Negotiation" and "Under Contract" stages closely. A high drop-off here often indicates pricing misalignment or documentation bottlenecks.
14.5 Team Analytics
Review team productivity and workload distribution at Dashboard > Analytics > Team.
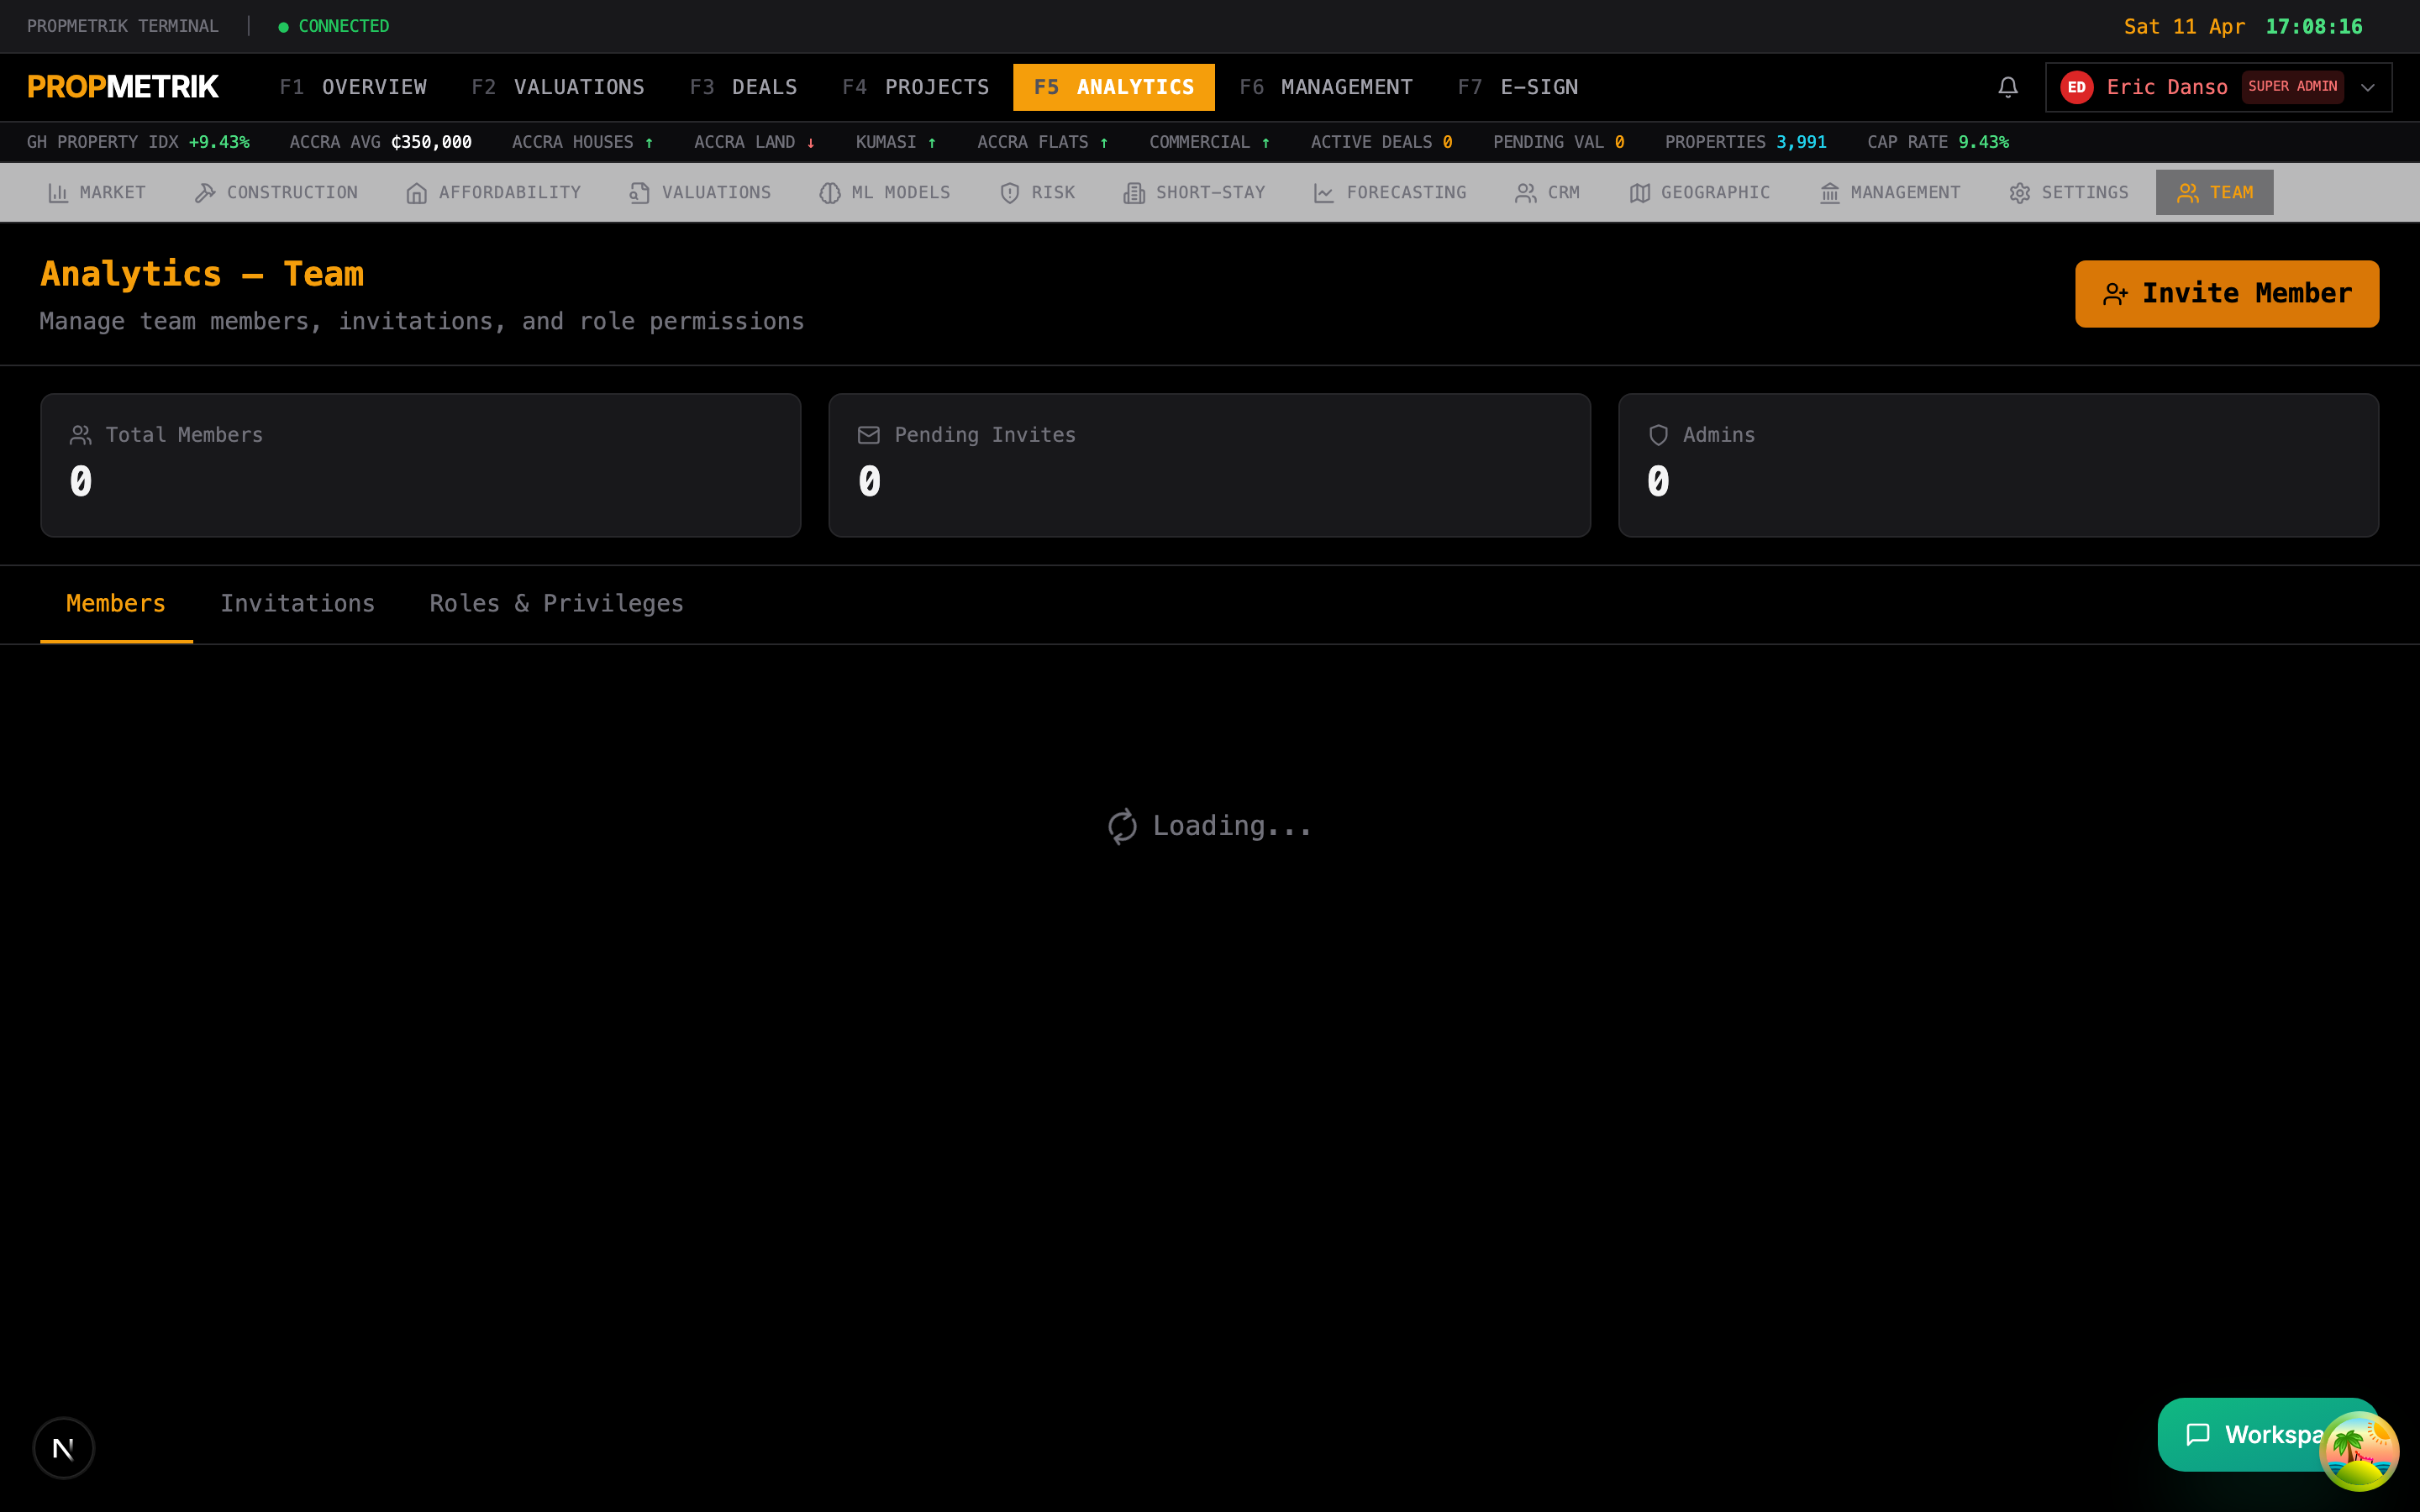
Team Performance Metrics
- Active Members -- Number of team members currently working on projects, valuations, or deals.
- Tasks Completed -- Total tasks completed across all modules in the selected period.
- Average Task Duration -- Mean time to complete assigned tasks.
- Overdue Task Rate -- Percentage of tasks completed after their due date.
Individual Performance Cards
Each team member's card shows:
- Module distribution -- What percentage of their time is spent on projects, valuations, deals, or property management.
- Task completion rate -- Percentage of assigned tasks completed on time.
- Active assignments -- Current open items across all modules.
- Utilization rate -- Percentage of available capacity currently allocated.
Workload Heatmap
The heatmap visualization shows team capacity over time:
- Green cells indicate available capacity.
- Amber cells indicate near-full allocation.
- Red cells indicate over-allocation.
Use this view to identify team members who need workload redistribution and plan resource allocation for upcoming projects.
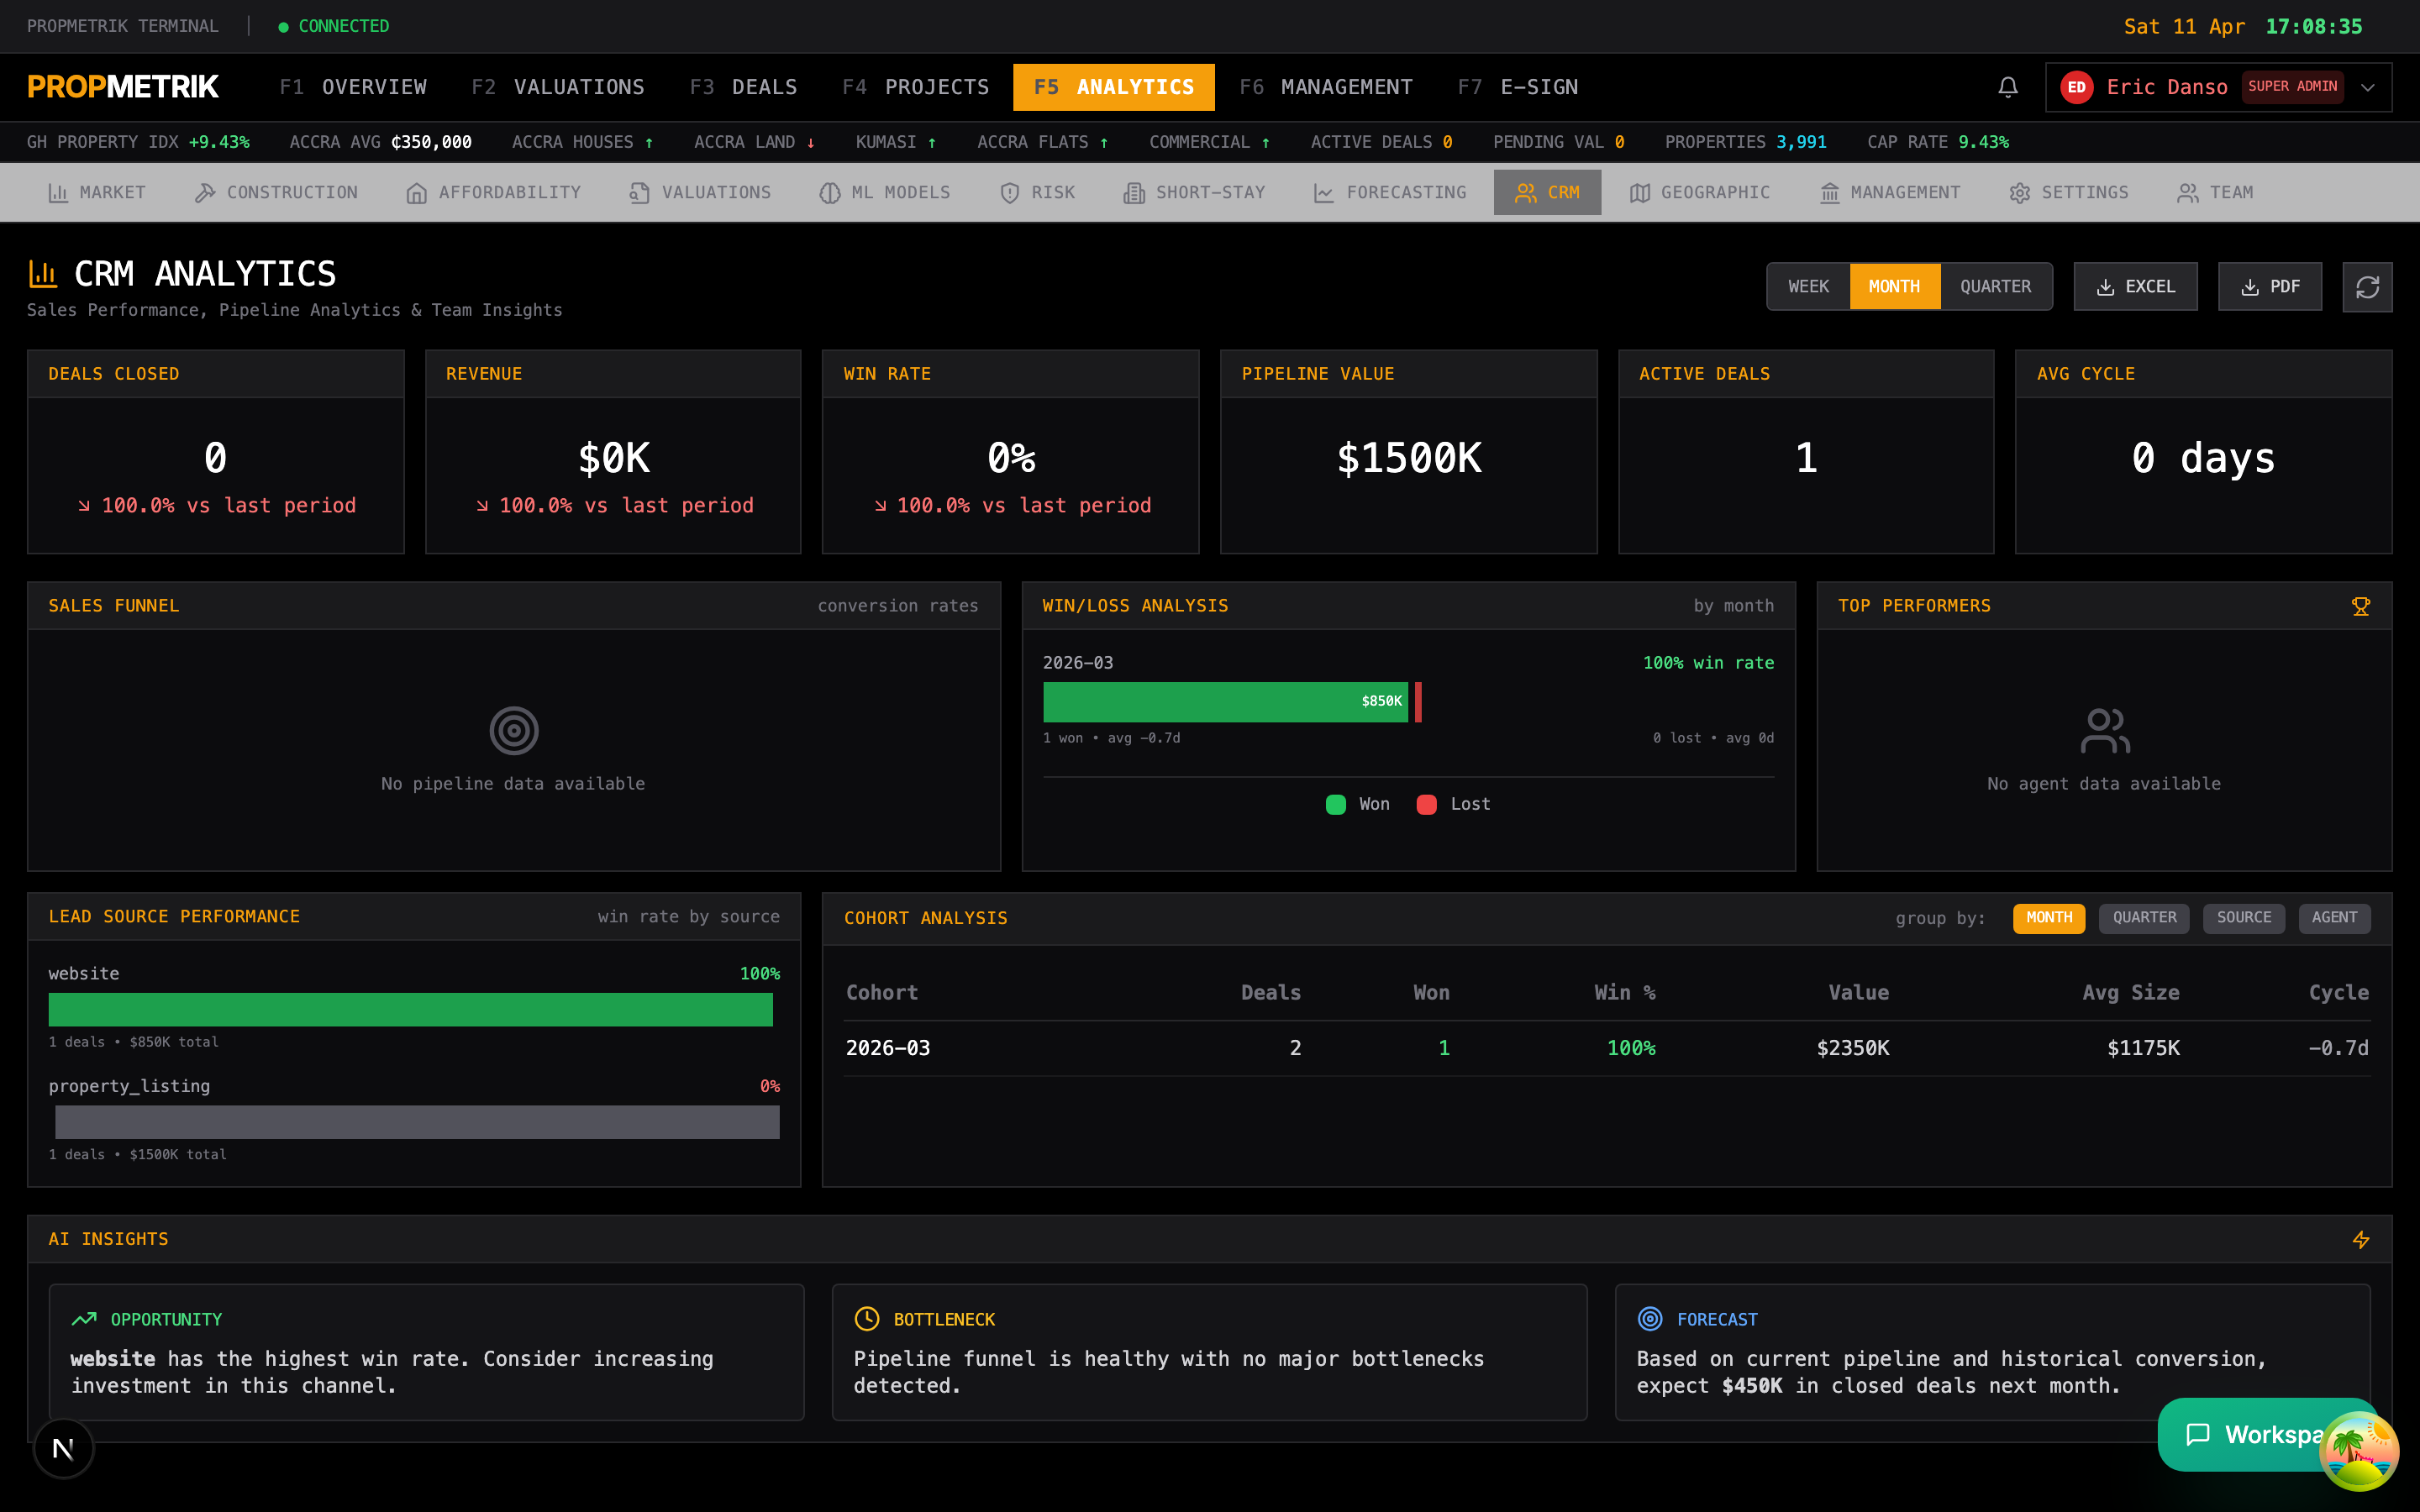
14.6 CRM Analytics
Deep-dive into customer relationship metrics at Dashboard > Analytics > CRM.
Contact Engagement
- Total Contacts -- Active contacts in the CRM database.
- Engagement Score Distribution -- How contacts are distributed across engagement tiers (hot, warm, cold).
- Contact Growth -- New contacts added over time.
- Source Attribution -- Where contacts come from (referral, web inquiry, walk-in, drip campaign, import).
Campaign Performance
If you are running drip campaigns (see Chapter 08 -- Deals & CRM):
- Campaign Open Rates -- Percentage of campaign emails opened.
- Click-Through Rates -- Percentage of recipients who clicked a link.
- Conversion Rates -- Percentage of campaign recipients who became active leads.
- Revenue Attribution -- Revenue from deals that originated from campaigns.
Lead Scoring
The CRM analytics page shows how the automated lead scoring model is performing:
- Score Distribution -- Histogram of lead scores across all active leads.
- Conversion by Score Band -- What percentage of leads in each score range convert to deals.
- Top Scoring Factors -- Which attributes most strongly predict conversion (property type interest, engagement frequency, budget range).
14.7 Management Analytics
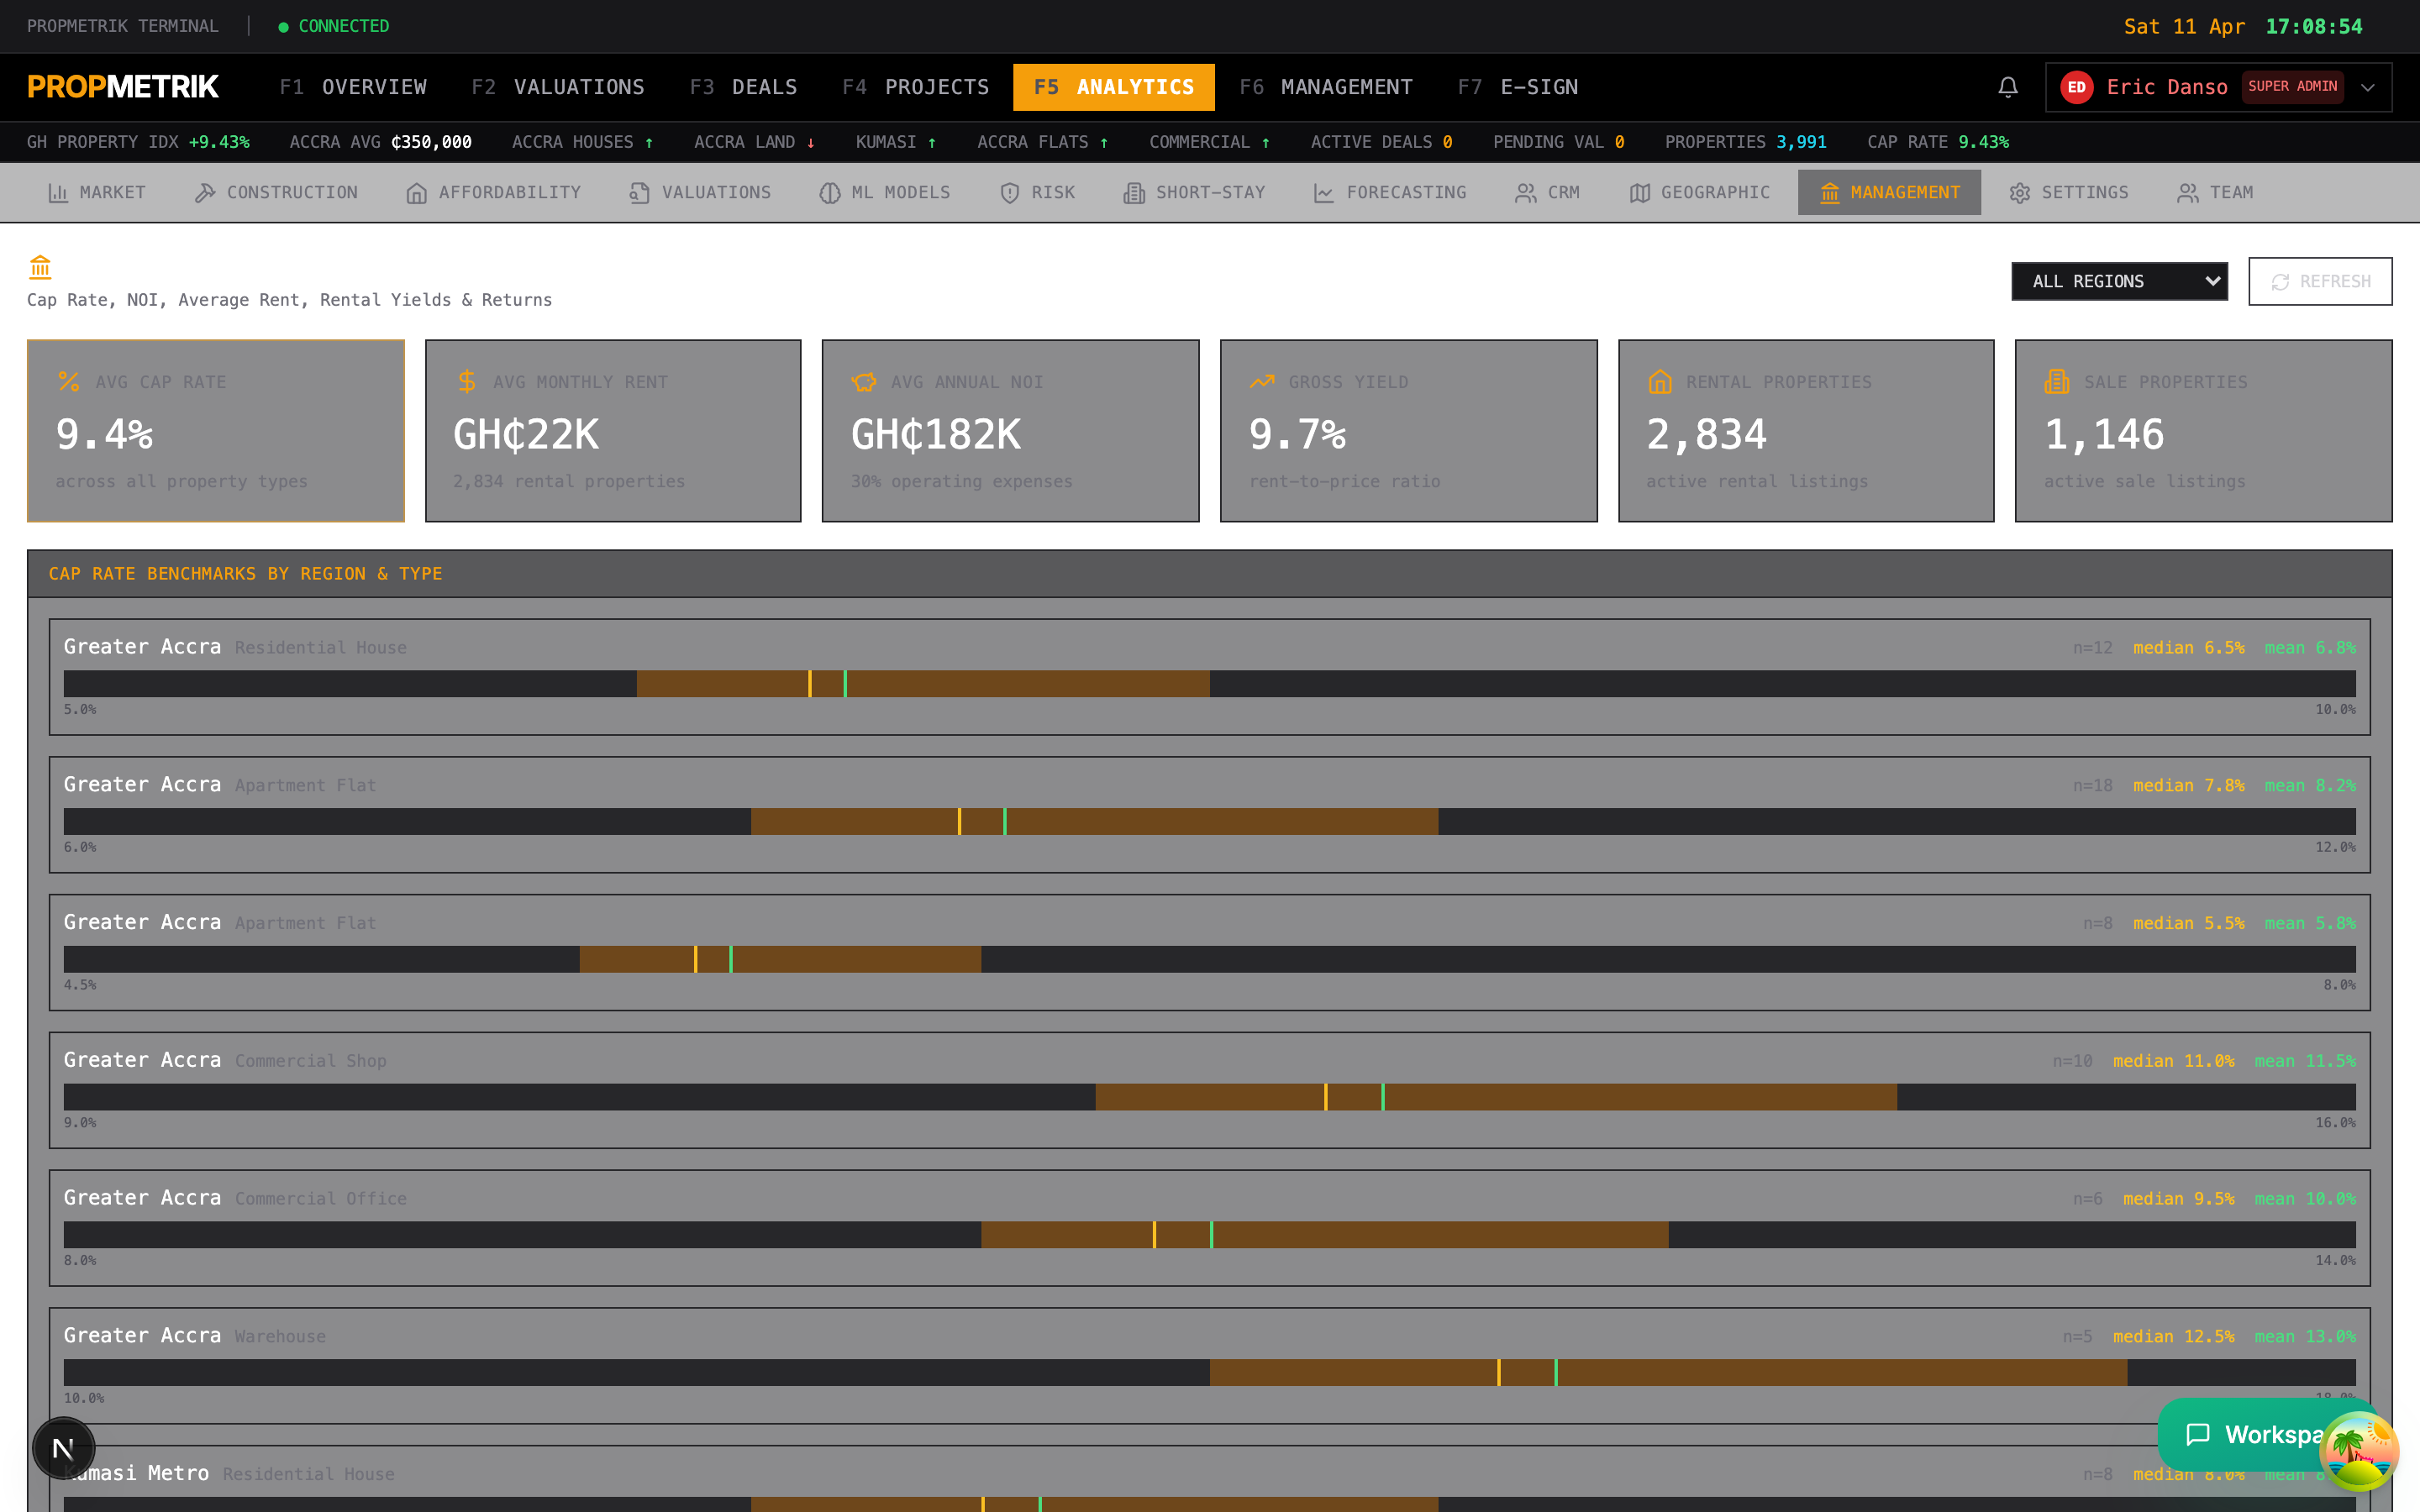
Access executive-level dashboards at Dashboard > Analytics > Management.
Executive Dashboard
The management analytics page consolidates metrics from all modules into a single executive view:
- Revenue Summary -- Total revenue across valuations, property management fees, deal commissions, and project invoices.
- Portfolio Performance -- Occupancy rates, rental income, and NOI (Net Operating Income) across managed properties.
- Project Health -- Aggregate project status (on-track, delayed, at-risk) with budget variance summary.
- User Growth -- Platform adoption metrics including new users, active users, and user retention.
KPI Tracking
Define and track organization-level KPIs:
- Set targets for key metrics (e.g., "Complete 50 valuations per month" or "Maintain 95% occupancy").
- View actual vs. target performance with trend indicators.
- Configure alerts when KPIs fall below threshold.
Cross-Module Trends
The trend charts at the bottom show how key metrics evolve over time:
- Monthly revenue by module
- Valuation pipeline growth
- Property occupancy trends
- Deal conversion rate trends
- Team utilization patterns
Tip: Share the management analytics URL with your leadership team. The page updates in real-time and provides a comprehensive snapshot without requiring recipients to navigate multiple modules.
14.8 Valuation Leaderboard
Compare valuer performance at Dashboard > Analytics > Valuations > Leaderboard.
Leaderboard Rankings
The leaderboard ranks valuers by a composite performance score calculated from:
| Factor | Weight | Description |
|---|---|---|
| Volume | 30% | Number of valuations completed |
| Turnaround | 25% | Average time from instruction to report delivery |
| Accuracy | 20% | Deviation between estimated and actual sale prices (where data is available) |
| Revenue | 15% | Total fee revenue generated |
| Client Feedback | 10% | Average satisfaction rating from clients |
Leaderboard Features
- Time Period Selector -- View rankings for the current month, quarter, year, or a custom date range.
- Filter by Property Type -- See rankings for specific property categories (residential, commercial, land).
- Filter by Region -- Compare performance within specific geographic areas.
- Trend Indicators -- Arrows show whether each valuer's rank is improving or declining compared to the previous period.
Individual Valuer Drill-Down
Click any valuer's name to see their detailed performance profile:
- Valuation history with property types and values
- Turnaround time trend chart
- Revenue contribution over time
- Active assignments and pipeline
14.9 Sensitivity Analysis
Model the impact of variable changes on property valuations at Dashboard > Analytics > Valuations > Sensitivity.
What Is Sensitivity Analysis?
Sensitivity analysis lets you test how changes to key assumptions affect a property's estimated value. This is essential for:
- Understanding which variables have the greatest impact on valuation
- Presenting best-case and worst-case scenarios to clients
- Stress-testing valuations against market shifts
- Validating model robustness
Running a Sensitivity Analysis
- Navigate to Analytics > Valuations > Sensitivity.
- Select the valuation to analyze (or enter property parameters manually).
- Choose the variables to test:
| Variable | Example Range |
|---|---|
| Capitalization Rate | +/- 1-3 percentage points |
| Discount Rate | +/- 1-3 percentage points |
| Rental Growth Rate | +/- 2-5 percentage points |
| Vacancy Rate | +/- 5-15 percentage points |
| Operating Expense Ratio | +/- 5-10 percentage points |
| Terminal Cap Rate | +/- 1-2 percentage points |
| Construction Cost Escalation | +/- 5-15% |
- Set the step size (how much each variable changes per increment) and the range (minimum and maximum values to test).
- Click Run Analysis.
Interpreting Results
The output includes:
- Tornado Chart -- Horizontal bar chart showing which variables have the greatest impact on value. The widest bars indicate the most sensitive variables.
- Data Table -- Tabular output showing the estimated value at each variable level.
- Spider Chart -- Multi-axis chart showing how value changes as each variable moves from its base case.
- Scenario Matrix -- Two-variable grid showing values at intersections of two selected variables (e.g., cap rate vs. vacancy rate).
Exporting Sensitivity Analysis
- PDF Report -- Formatted report with charts, tables, and methodology notes suitable for client presentation.
- Excel -- Full data export with all calculated scenarios for further analysis.
- Embed in Valuation Report -- Insert the sensitivity analysis as an appendix to the main valuation report.
Tip: Always include a sensitivity analysis when presenting valuations to institutional clients or lenders. Focus on the 2-3 variables that show the greatest impact, and explain what market conditions could cause those variables to shift.
14.10 Additional Analytics Modules
PROPMETRIK includes several specialized analytics modules accessible from the main Analytics sidebar:
Affordability Analysis (Analytics > Affordability)
- Calculates the Housing Affordability Index (HAI) for different income brackets and locations.
- Shows monthly mortgage payment as a percentage of median household income.
- Compares affordability across regions, property types, and time periods.
- Powered by Bank of Ghana interest rate data and PROPMETRIK's property price database.
Construction Analytics (Analytics > Construction)
- Tracks the Construction Cost Index (CCI) over time.
- Breaks down cost drivers: materials, labor, fuel, equipment, and overheads.
- Compares construction costs across building types and regions.
- Provides cost forecasting based on historical trends and leading indicators.
Risk Assessment (Analytics > Risk)
- Property-level risk scoring incorporating:
- Flood risk -- Based on NADMO incident data and geographic elevation.
- Market risk -- Price volatility and liquidity measures.
- Credit risk -- Tenant payment history and financial stability.
- Regulatory risk -- Zoning compliance and permitting status.
- Portfolio-level risk aggregation and diversification analysis.
- Risk-adjusted return calculations for investment properties.
Geographic Analytics (Analytics > Geographic)
- Interactive map-based visualizations of property data.
- Heatmaps for property values, rental rates, transaction volumes, and risk scores.
- Neighborhood-level market statistics and comparables.
- Distance-based analysis for amenities, transport links, and infrastructure.
Summary
| Task | Where to Go |
|---|---|
| Generate a project report | Projects > [Project] > Reports |
| Schedule automated reports | Projects > [Project] > Reports > Schedule |
| View PM compliance reports | Analytics > PM Reports |
| Analyze valuation production | Analytics > Valuations |
| Track deal pipeline | Analytics > Deals |
| Review team workload | Analytics > Team |
| Monitor CRM engagement | Analytics > CRM |
| Access executive dashboards | Analytics > Management |
| Compare valuer performance | Analytics > Valuations > Leaderboard |
| Run sensitivity analysis | Analytics > Valuations > Sensitivity |
| Check housing affordability | Analytics > Affordability |
| Track construction costs | Analytics > Construction |
| Assess property risk | Analytics > Risk |
| View geographic analytics | Analytics > Geographic |