
Data Hub & Analytics
Market data, construction indices, economic indicators, ML insights, ETL pipelines, spiders, and forecasting.
Chapter 11 -- Data Hub & Analytics
Overview
The PROPMETRIK Data Hub is the intelligence engine that powers every analytical feature in the platform. It ingests real estate data from government registries, financial institutions, partner APIs, community contributions, and public web sources, then processes it through ETL pipelines, quality checks, and machine-learning models to produce market intelligence for the Ghanaian property market.
The Data Hub and Analytics modules are split across two areas of the platform:
- Analytics (Dashboard > Analytics) -- consumer-facing dashboards for market insights, forecasting, risk, affordability, construction costs, and ML model outputs.
- Data Hub Administration (Dashboard > Admin > Data Hub) -- backend administration for data sources, ingestion pipelines, quality management, spiders, and system configuration.
All analytics use PROPMETRIK's terminal-style dark UI with amber accents and monospaced typography.
Part A: Analytics Dashboards
11.1 Market Analytics (Main)
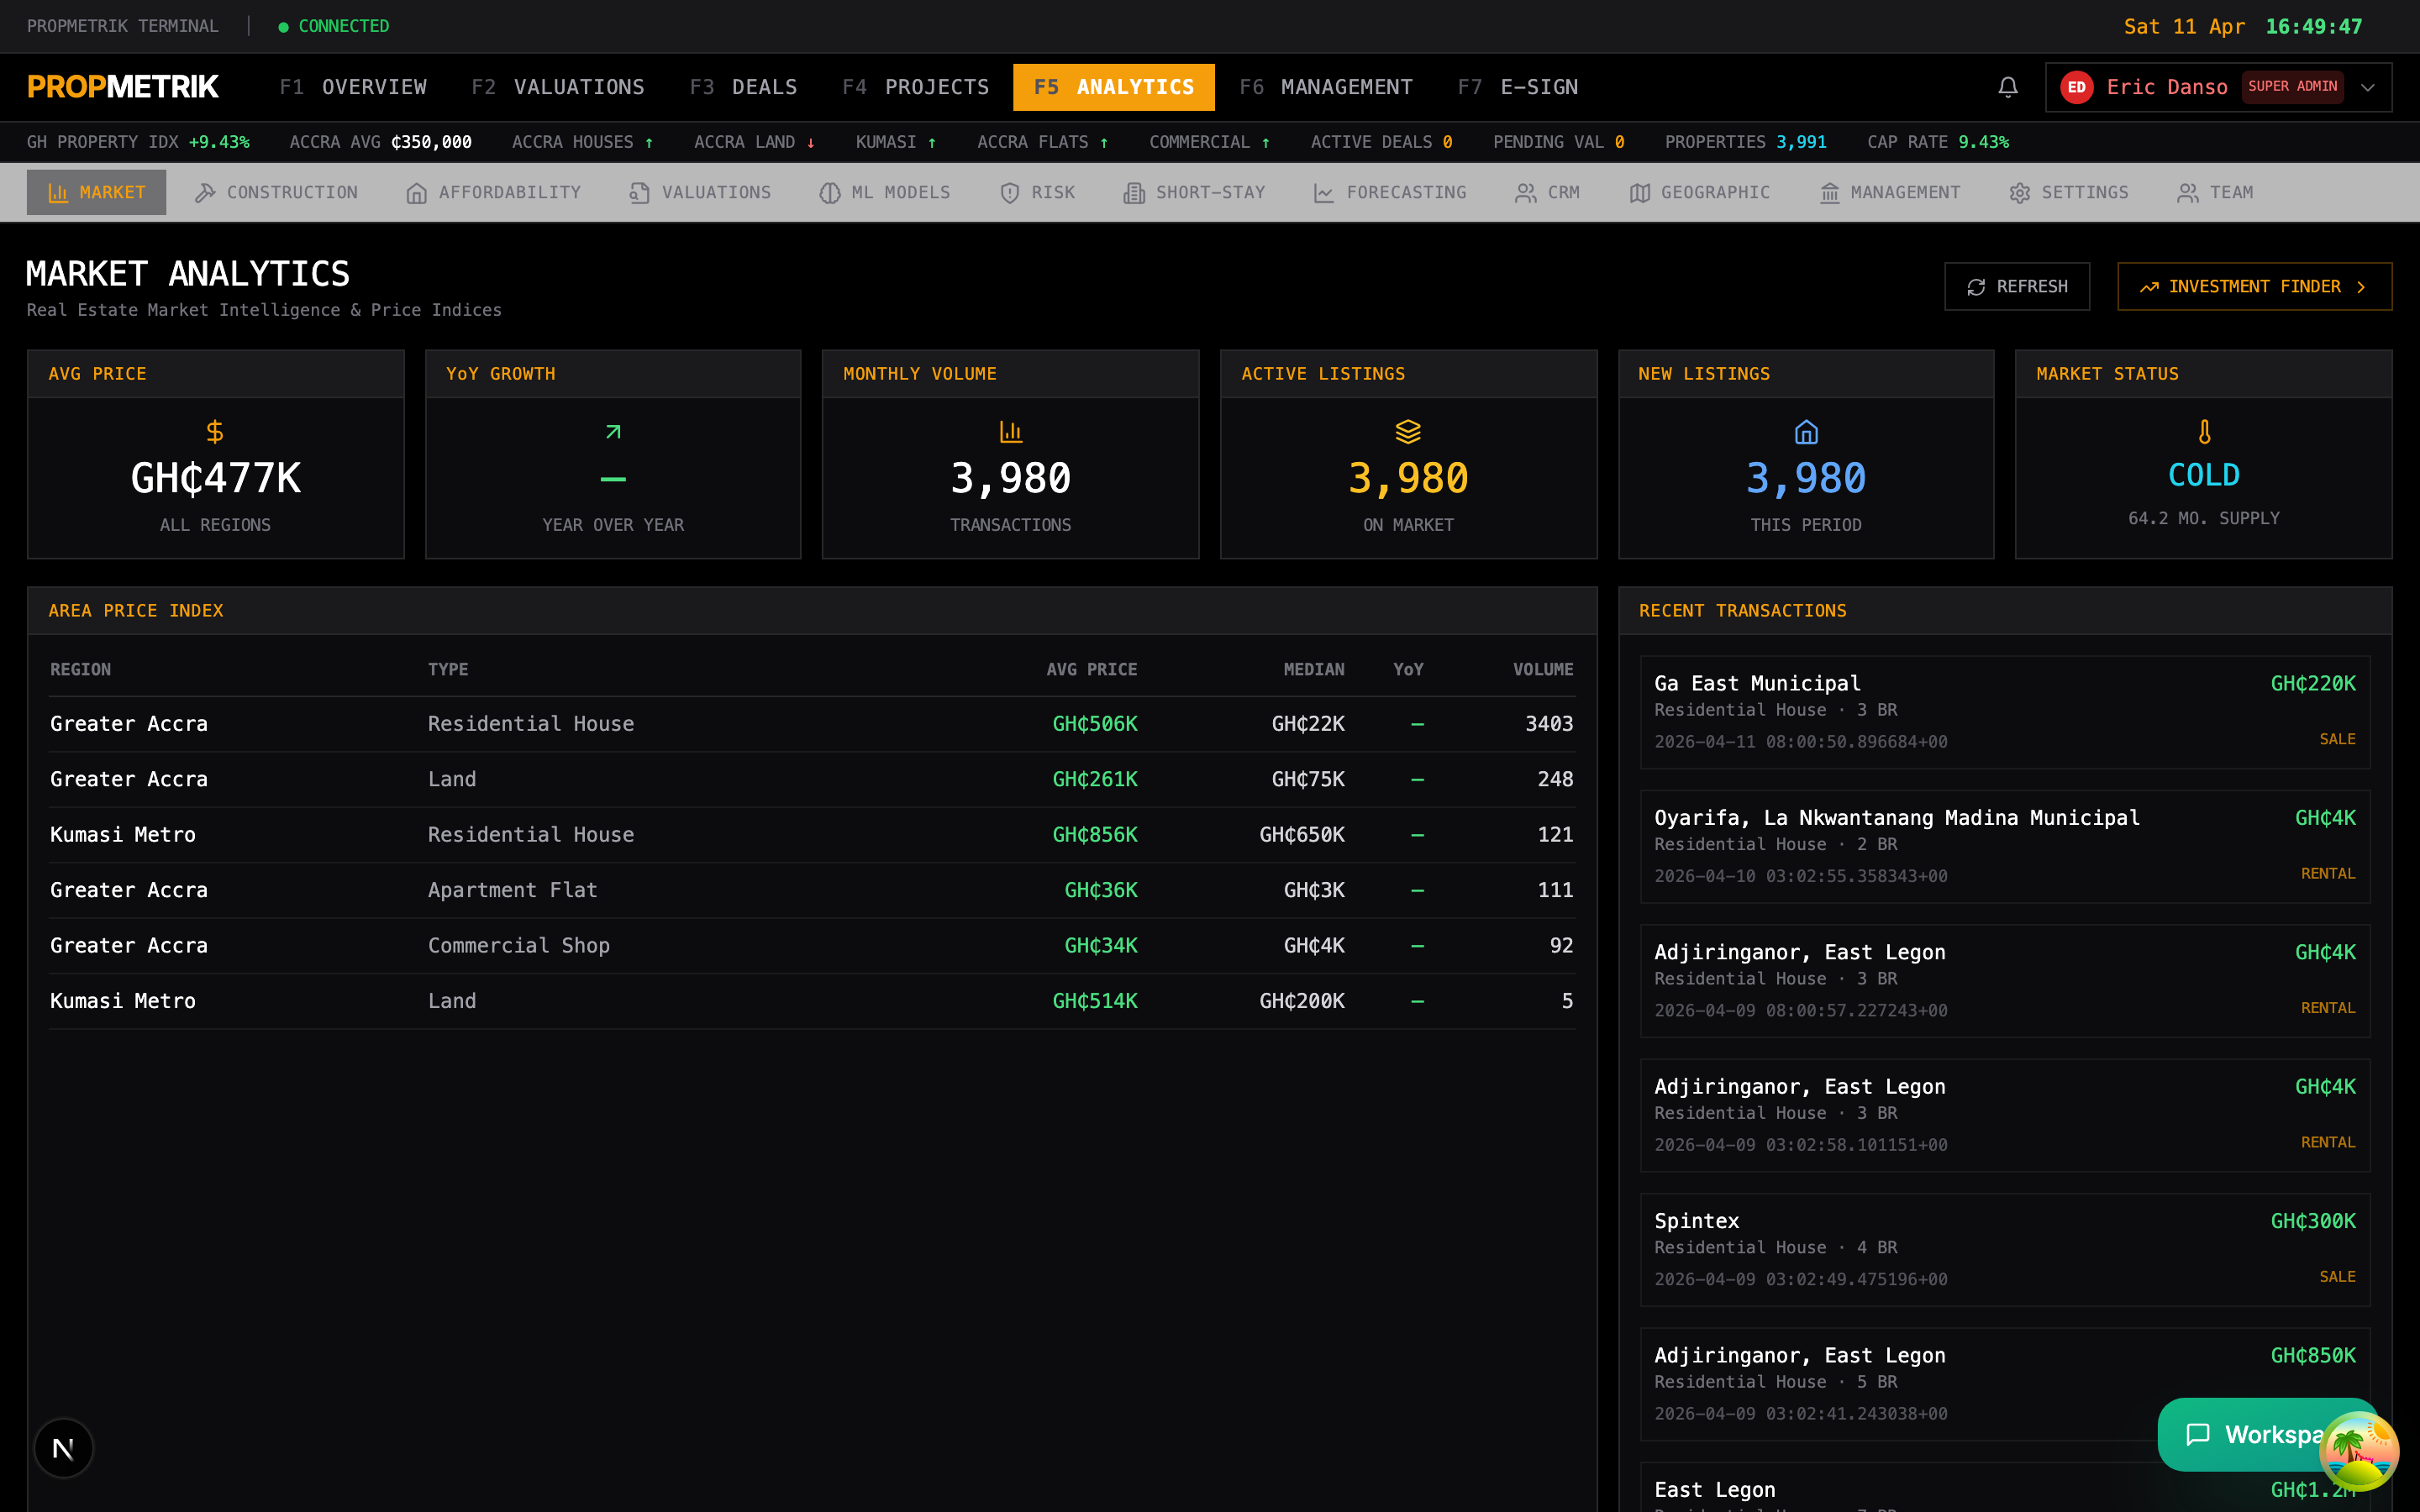
Navigate to Dashboard > Analytics to access the main market intelligence dashboard.
KPI Summary Bar
Six metric panels across the top:
| Panel | Shows |
|---|---|
| AVG PRICE | Average property price across all regions (GH₵) |
| YoY GROWTH | Year-over-year price change (green positive, red negative) |
| MONTHLY VOLUME | Transaction count for the current period |
| ACTIVE LISTINGS | Properties currently on the market |
| NEW LISTINGS | Properties listed this period |
| MARKET STATUS | Temperature reading (Hot, Warm, Balanced, Cool, Cold) with months of supply |
Area Price Index
A table showing price indices by region and property type:
- Region name
- Property type (Residential, Commercial, Land, etc.)
- Average price (GH₵)
- Median price
- Year-over-year change
- Transaction volume
Recent Transactions
A sidebar panel listing the latest property transactions with:
- Location
- Property type and bedrooms
- Final price in GH₵
- Price per square metre
- Transaction date and type (sale/rental)
Supply & Demand by Region
A table breaking down each region's market dynamics:
- Total supply
- Properties sold in the last 30 days
- Inventory months (how long current supply would last at current sales pace)
- Average days on market
- Market temperature (colour-coded: red for hot, amber for warm, green for balanced, blue for cool)
Price Distribution
A horizontal bar chart showing the percentage of transactions in each price bracket (e.g. "GH₵ 100K--200K: 23%").
Price Index Trend (12 Months)
A sparkline bar chart showing monthly median prices and month-over-month change percentages for the trailing 12 months.
Market Activity by Region
A comprehensive table with:
- Transaction count and total value
- Average price
- Active and new listings
- Average days on market
- Average discount from asking price
Tip: Click the INVESTMENT FINDER button in the header to jump to the Investment Analysis module for buy-side recommendations.
11.2 Affordability Analytics
Navigate to Dashboard > Analytics > Affordability.
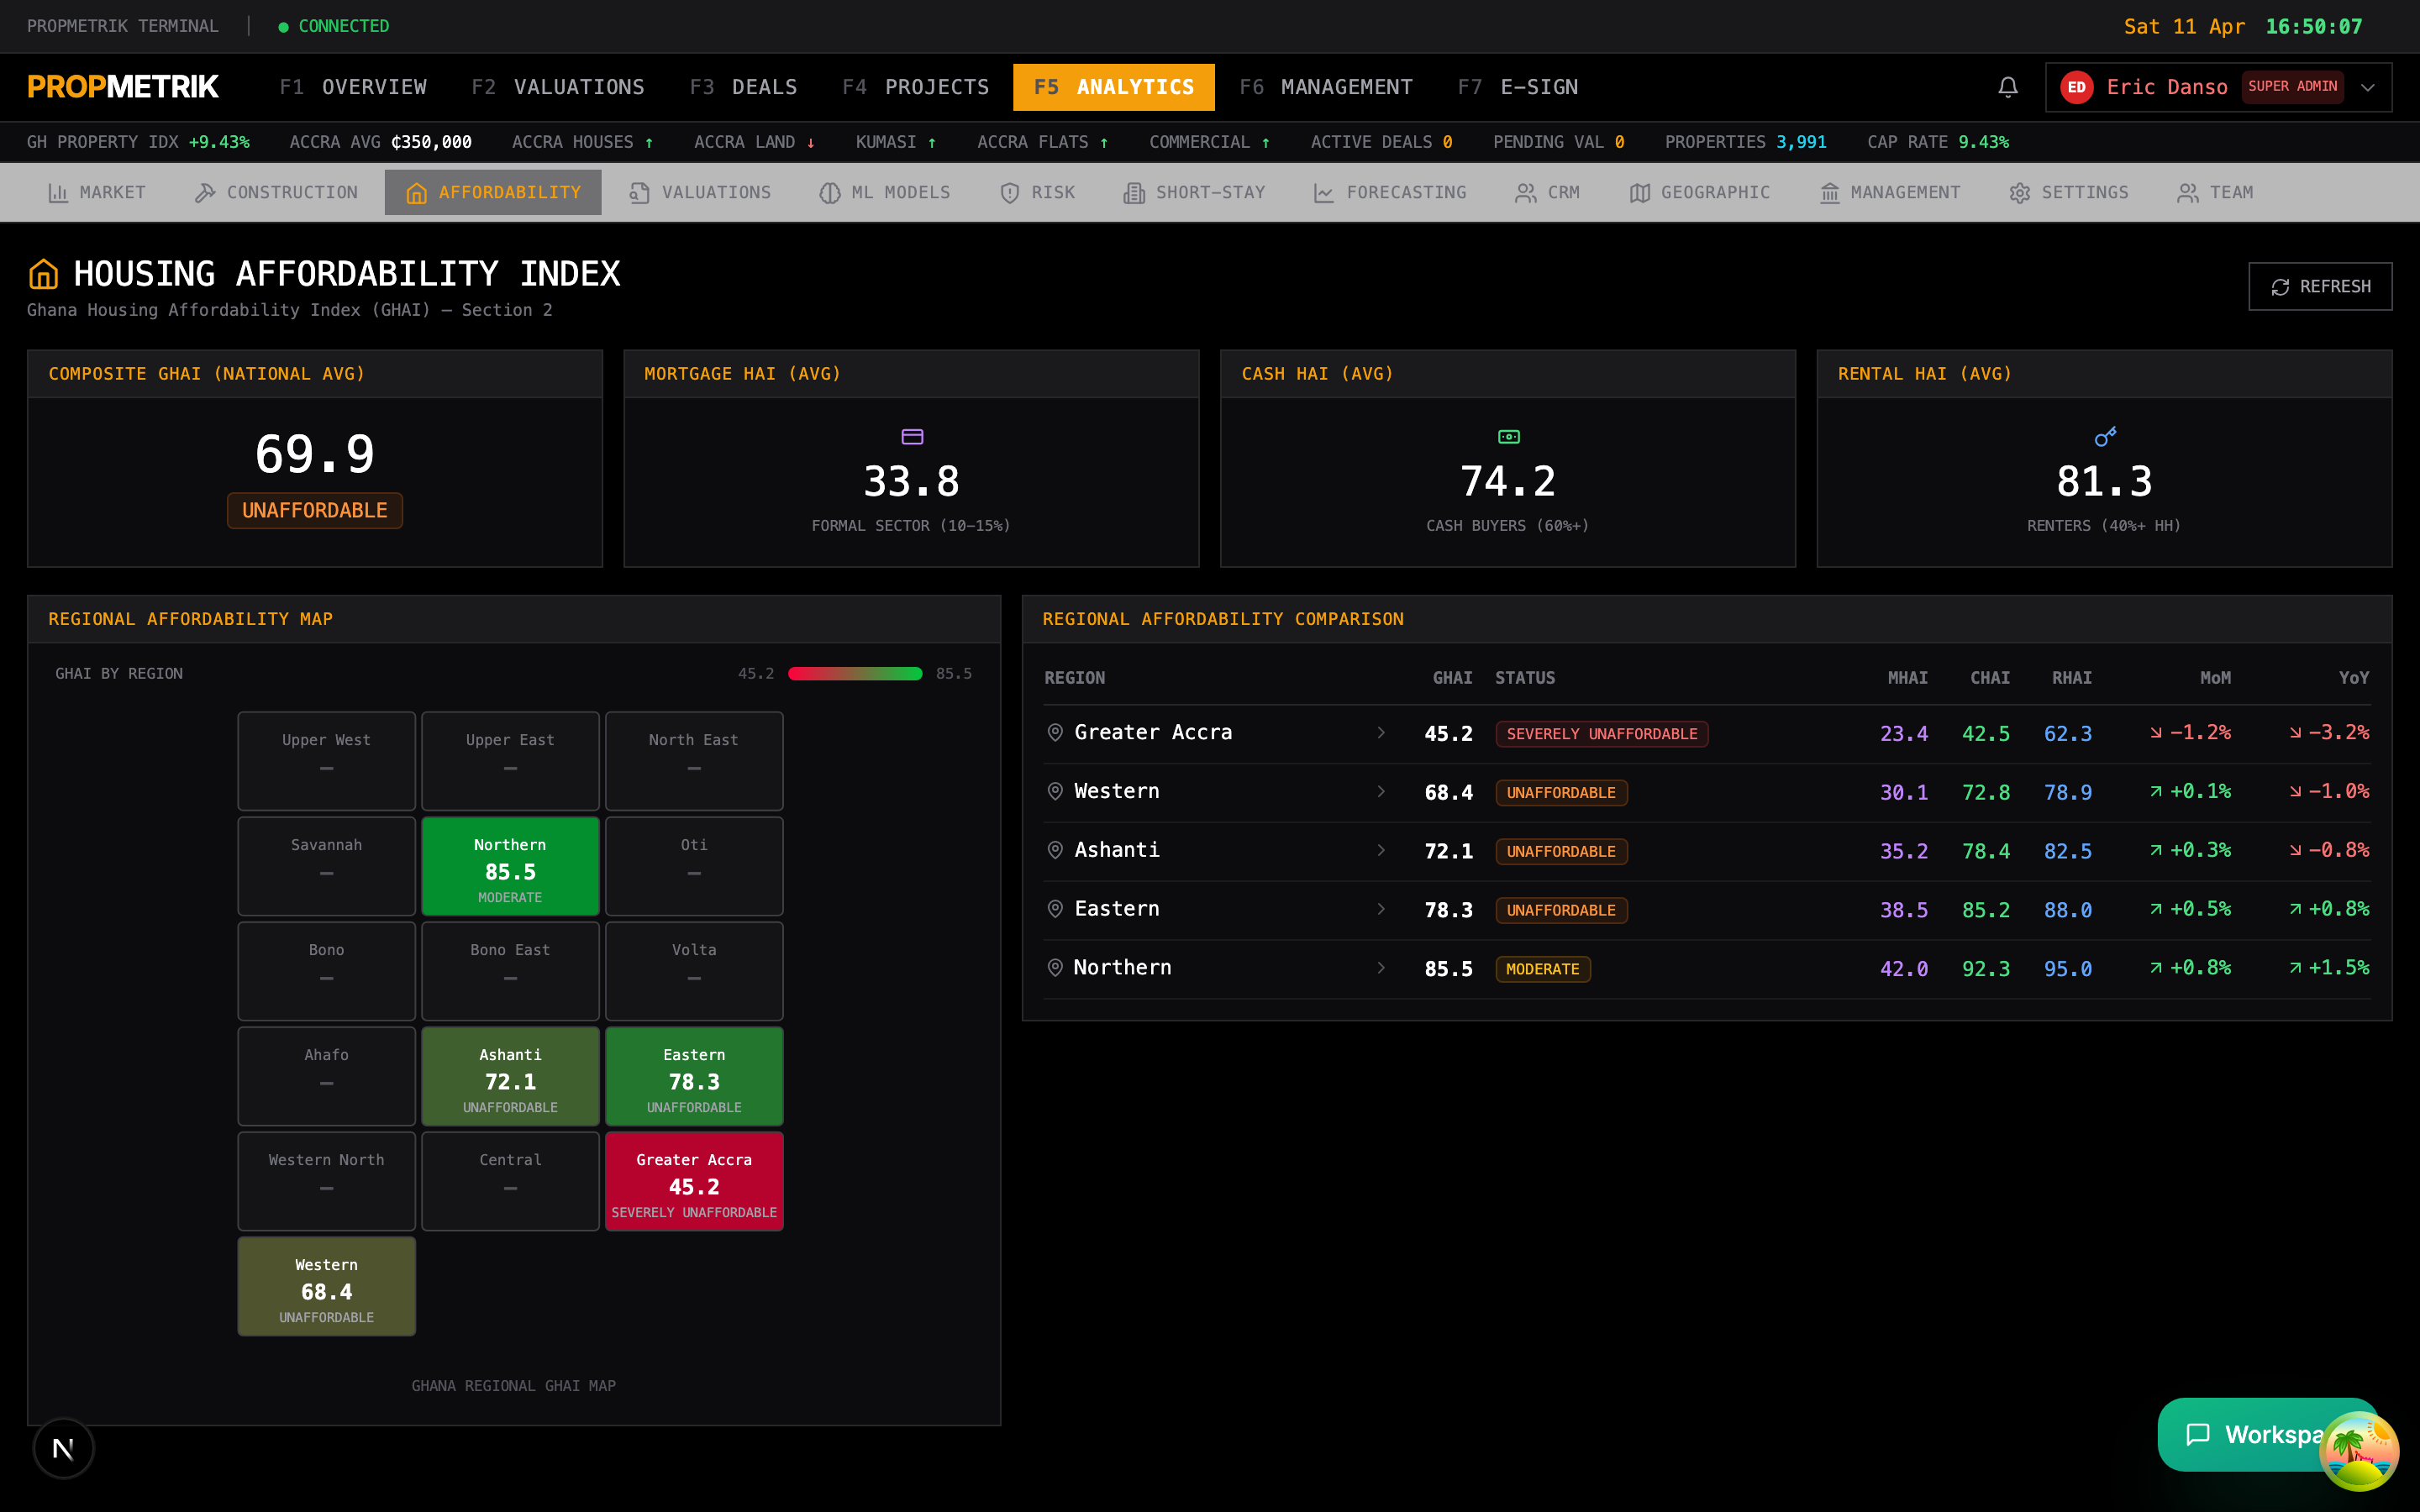
The Ghana Housing Affordability Index (GHAI) is a PROPMETRIK-exclusive composite index that measures how affordable housing is across regions.
GHAI Components
| Component | Abbreviation | Description |
|---|---|---|
| Mortgage Housing Affordability Index | MHAI | Affordability via mortgage financing |
| Cash Housing Affordability Index | CHAI | Affordability for outright cash purchases |
| Rental Housing Affordability Index | RHAI | Rental affordability relative to income |
| Cost Affordability Index | CAI | Construction cost vs. income |
| Location Affordability Index | LAI | Transport and infrastructure costs |
| Market Accessibility Score | MAS | How easy it is to enter the market |
Regional Dashboard
For each region the dashboard shows:
- GHAI composite score with category (Affordable, Moderate, Stretched, Unaffordable)
- Individual component scores
- Median property price and household income
- Current mortgage rate
- Median monthly rent
- Trend direction and month-over-month / year-over-year changes
Regional Heatmap
A colour-coded map of Ghana showing affordability by region. Darker colours indicate less affordable areas.
Alerts
The system generates alerts when:
- A region's GHAI changes category (e.g. Moderate to Stretched)
- Mortgage rates change significantly
- A region's affordability deteriorates rapidly
11.3 Construction Cost Analytics
Navigate to Dashboard > Analytics > Construction.
Construction Cost Index (CCI)
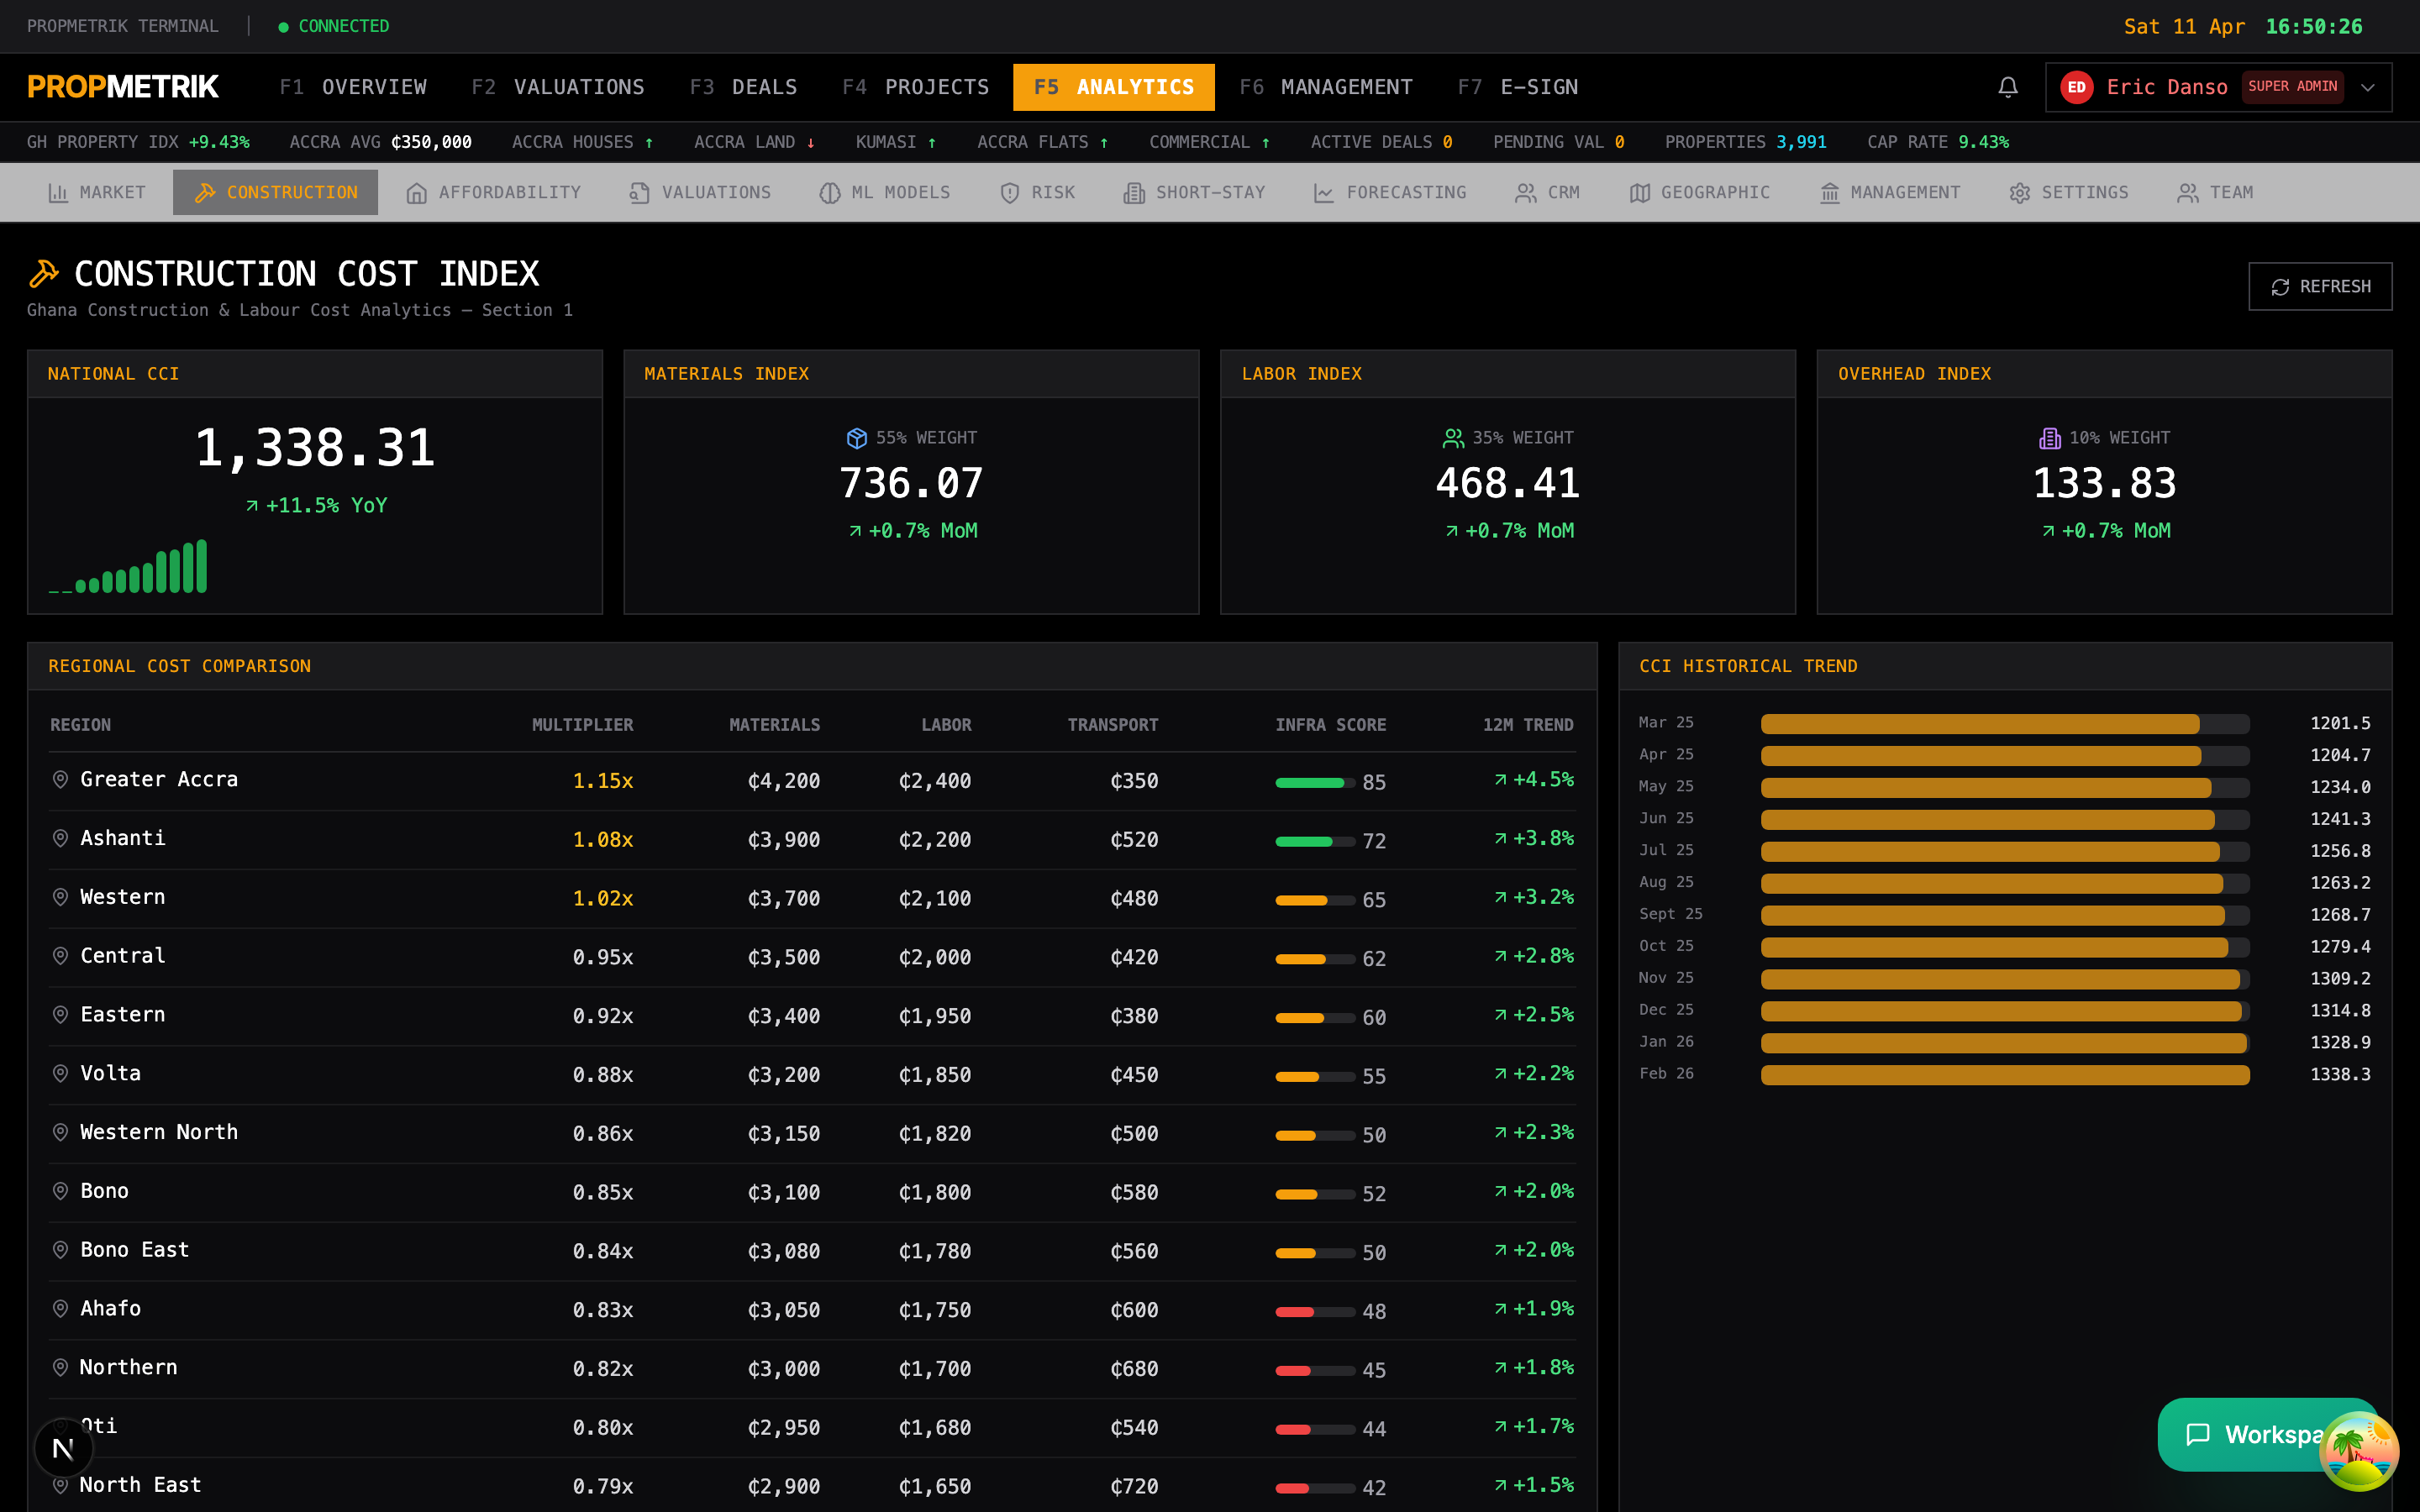
The national CCI is a weighted composite of three components:
- Materials -- cost of building materials (cement, steel, timber, etc.)
- Labour -- skilled and unskilled construction labour rates
- Overhead -- site management, insurance, permits
Each component shows:
- Current index value
- Component weight in the composite
- Month-over-month change
- Year-over-year change
Regional Cost Multipliers
A table showing how costs vary by region:
- Regional multiplier (1.0 = national average)
- Distance from port (affects transport costs)
- Transport factor
- Infrastructure score
- Cost component breakdown (materials, labour, transport)
- 6-month and 12-month trends
Material Prices
A detailed table of current material prices:
- Category and sub-category
- Unit price in GH₵ with unit of measure
- Local vs. import percentage
- Price volatility rating (Low, Medium, High)
- Month-over-month and year-over-year changes
Tip: Use the CCI trend chart to time large material purchases -- buying during seasonal dips can save 5--15% on material costs.
11.4 Forecasting
Navigate to Dashboard > Analytics > Forecasting.
CCI Forecasting
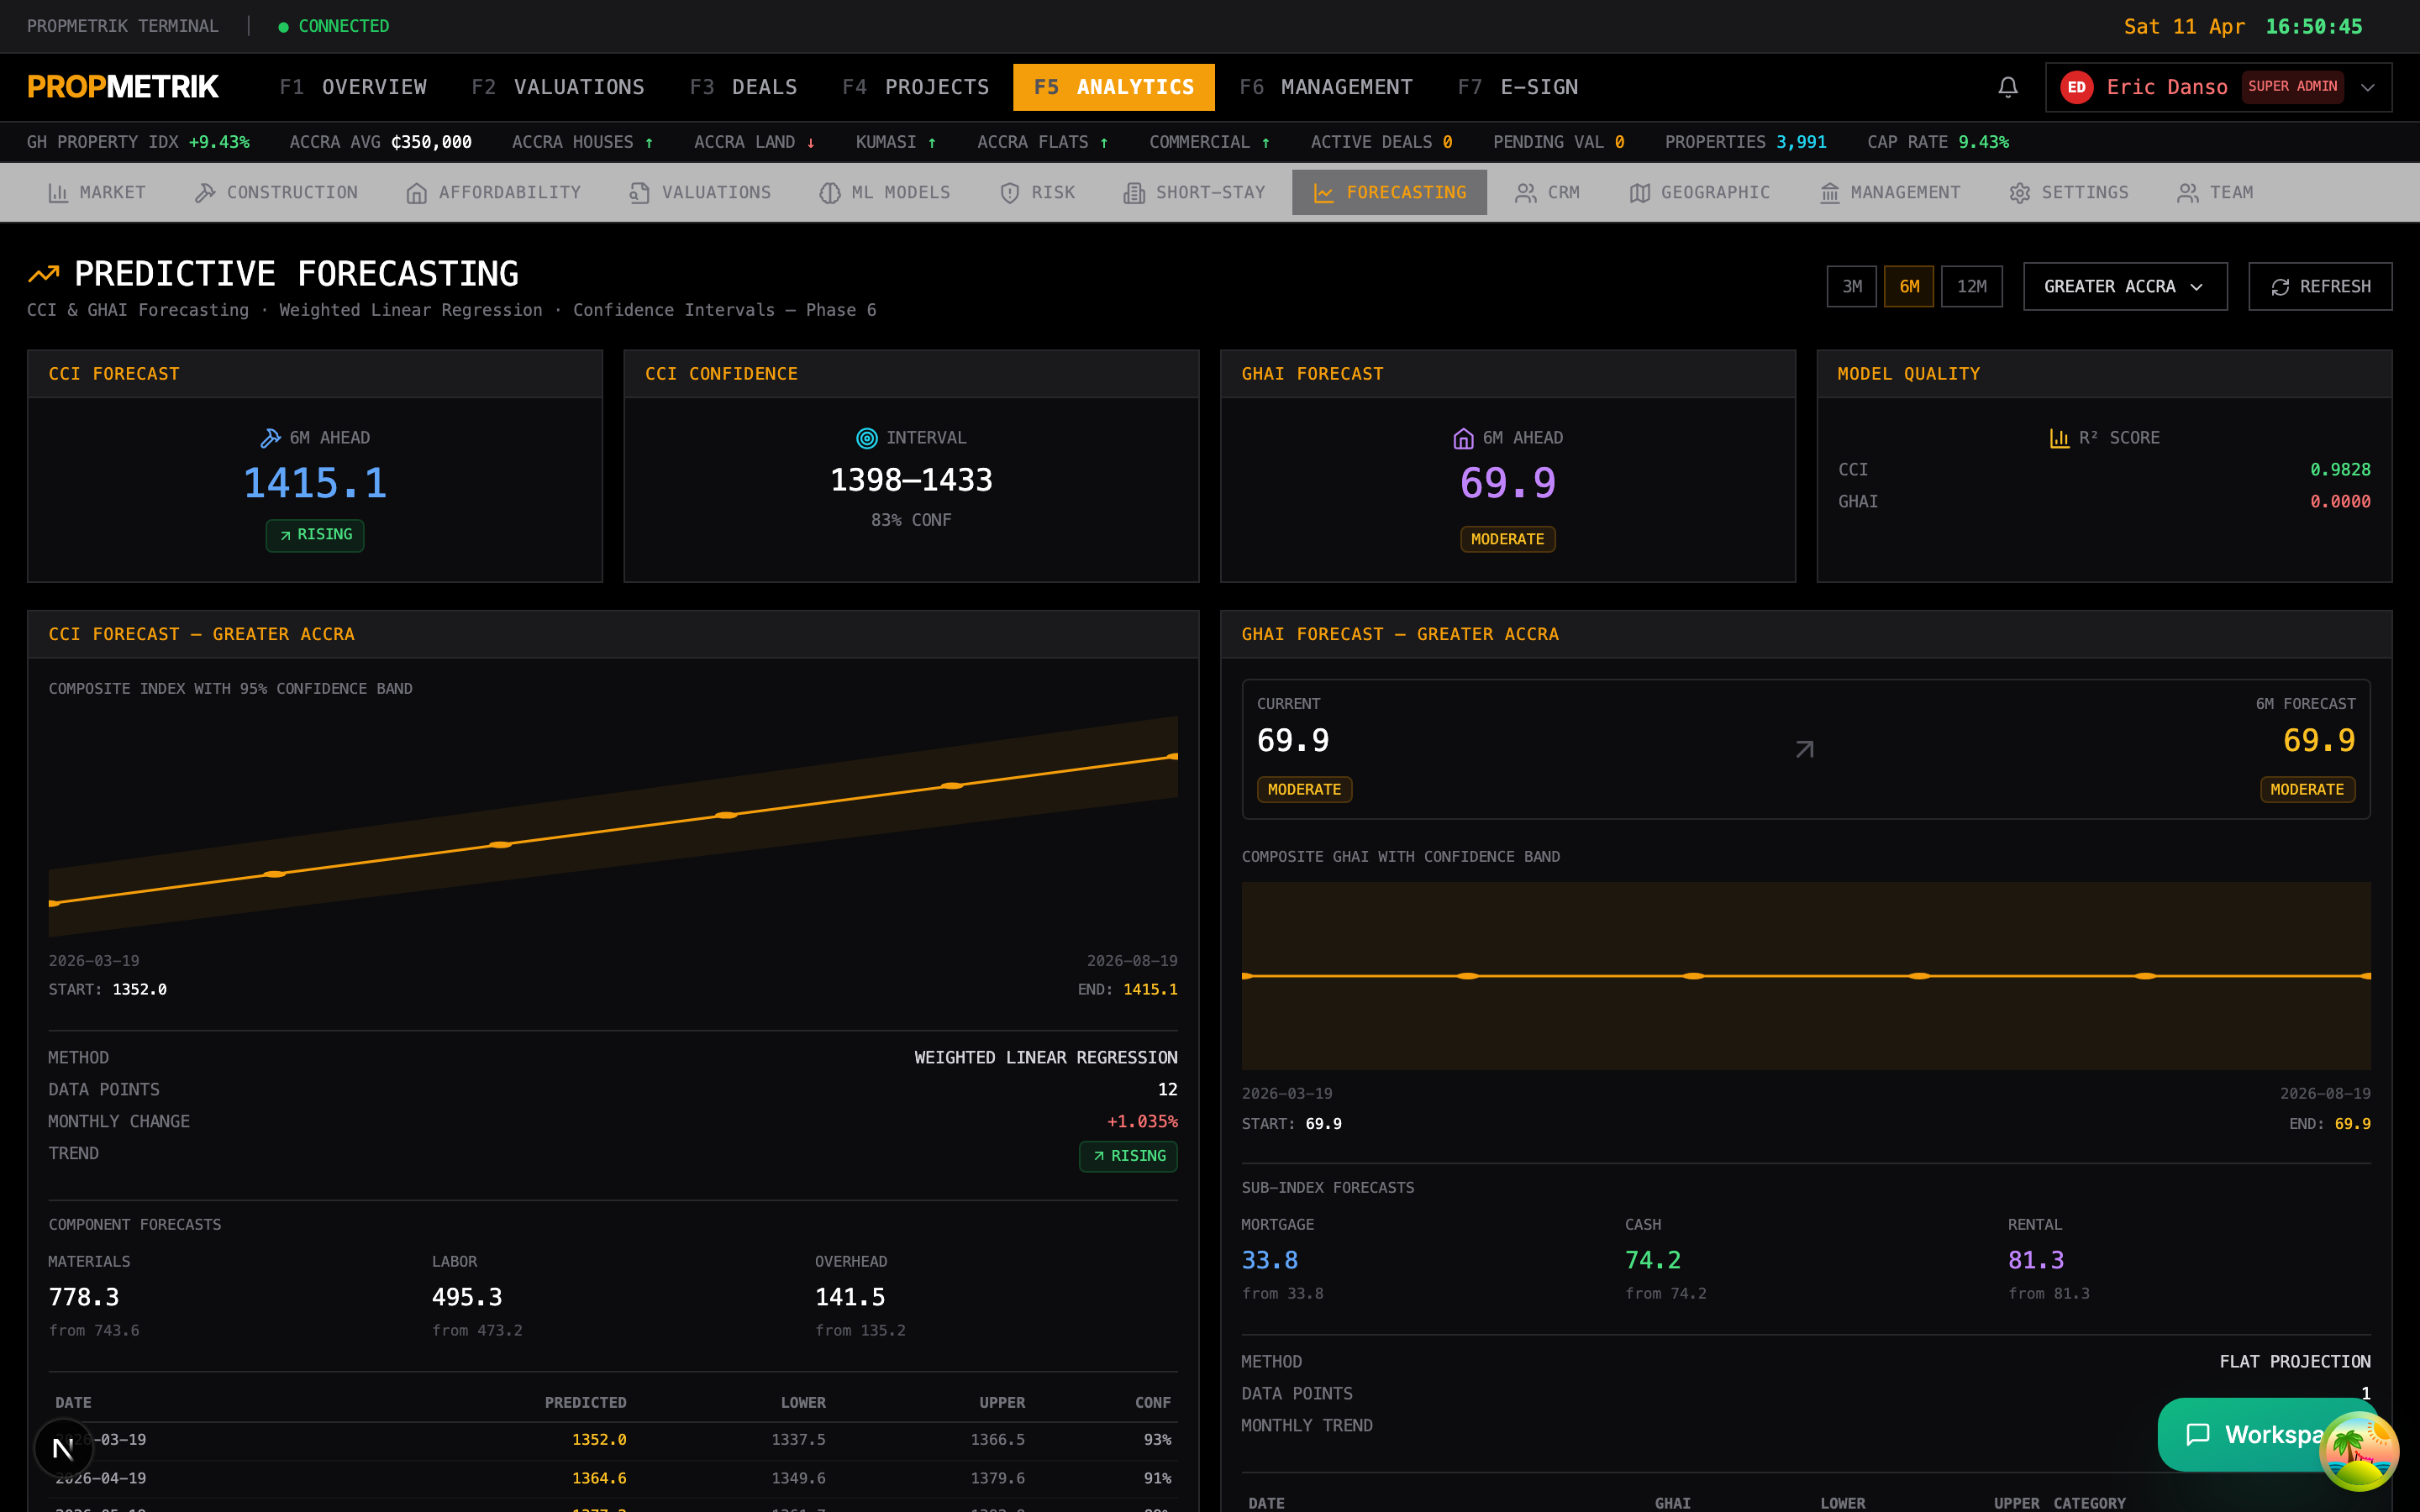
The Construction Cost Index forecaster projects future cost indices:
- Forecast Horizon -- 3, 6, or 12 months ahead.
- Predicted Index -- the projected CCI value.
- Confidence Interval -- upper and lower bounds.
- Model Info -- method used, data points, R-squared, trend direction, monthly change rate.
- Component Forecasts -- separate projections for materials, labour, and overhead.
GHAI Forecasting
The affordability forecaster projects how affordability will change:
- Current GHAI and category
- Predicted GHAI at each future period
- Whether the category is expected to change (e.g. Moderate to Stretched)
- Contributing factors driving the forecast
Price Forecasting
Property price predictions by region:
- Current median price
- 3/6/12-month price projections
- Confidence intervals
- Key drivers (supply changes, economic indicators, construction costs)
11.5 Geographic Analytics
Navigate to Dashboard > Analytics > Geographic.
- Interactive regional comparison charts
- Neighbourhood-level metrics (average price, transaction volume, days on market)
- Urban vs. peri-urban analysis
- Infrastructure proximity scoring
- School and amenity accessibility indices
11.6 Risk Analytics
Navigate to Dashboard > Analytics > Risk.
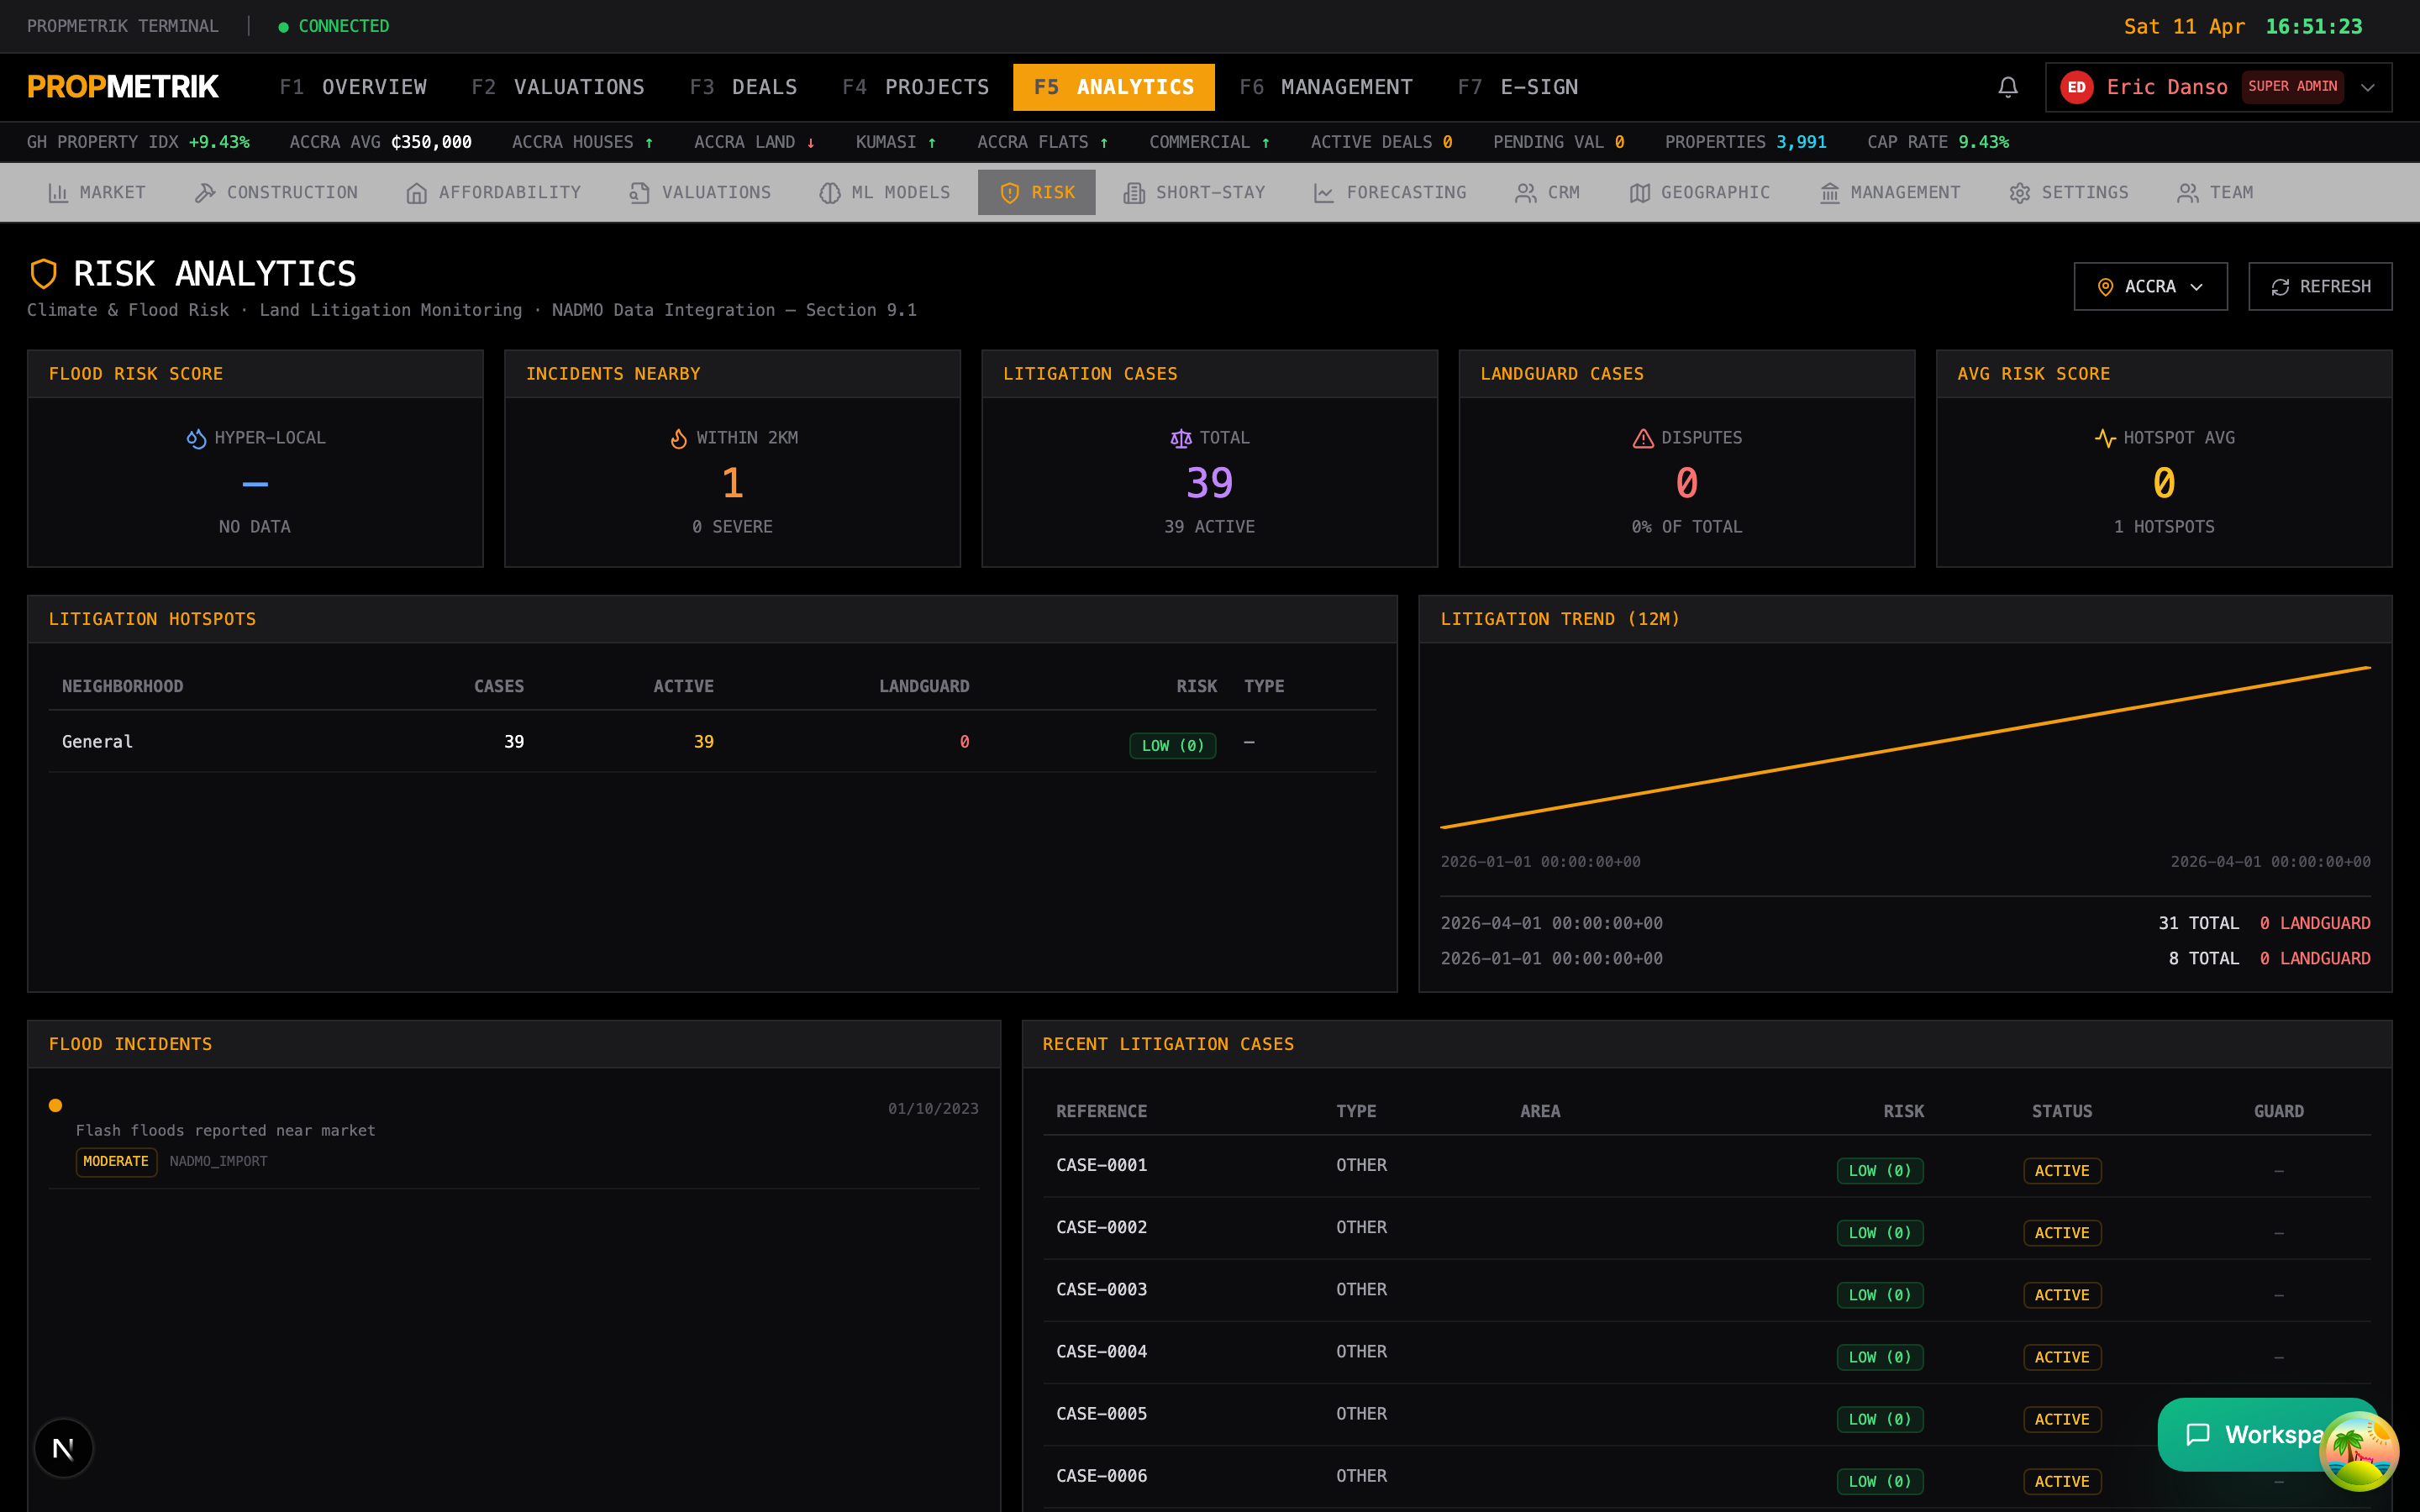
Flood Risk
- Flood risk scores by neighbourhood (0--100 scale)
- Risk level classification (Low, Moderate, High, Very High)
- Nearby flood incidents with distance
- Risk factors list
- Zone type and severity
- Recommendations
Recent Flood Incidents
A timeline of flood events with:
- Source and date
- Description and severity
- Neighbourhood and city
- Latitude/longitude coordinates
Land Litigation Risk
- Active cases by region
- Case reference and dispute type
- Status (pending, resolved, appealed)
- Risk score
- Filing date
Environmental Hazards
- Proximity to industrial zones
- Soil contamination risk
- Noise pollution zones
- Air quality indices
Tip: Always check the Risk Analytics for a property's neighbourhood before finalising a valuation or deal -- flood risk alone can impact value by 10--25%.
11.7 Short-Stay Analytics
Navigate to Dashboard > Analytics > Short-Stay.
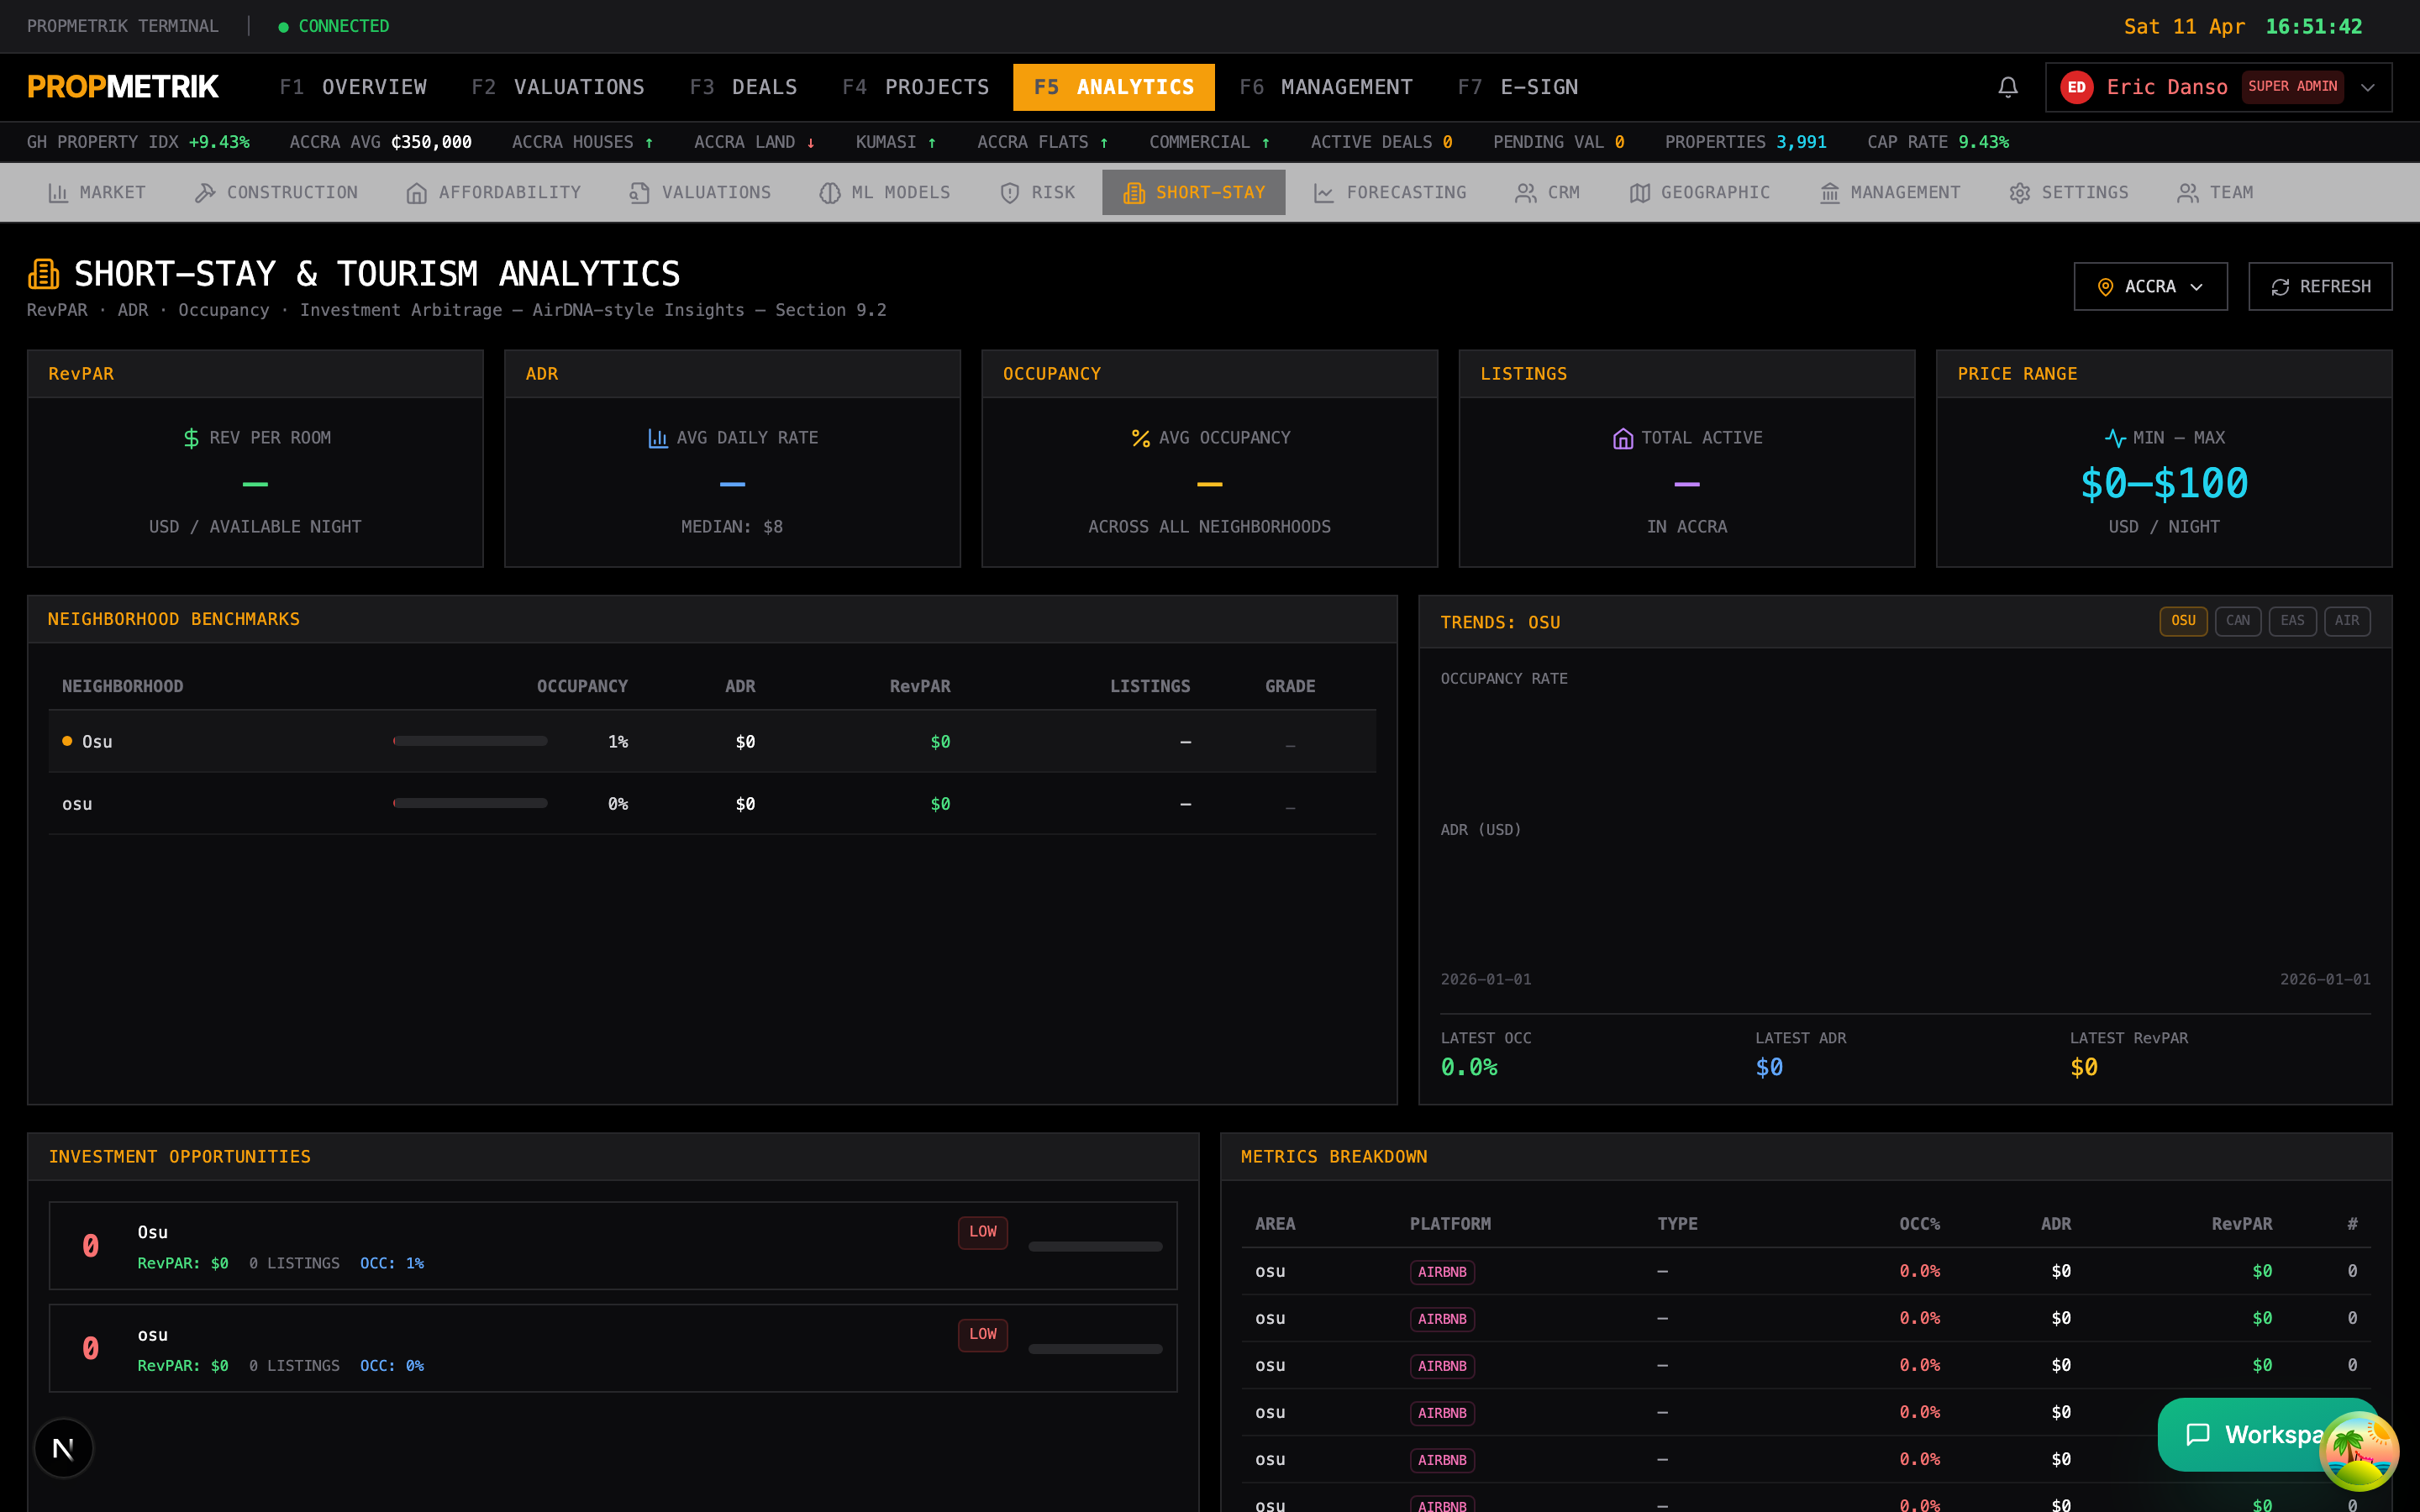
- Average daily rates by neighbourhood
- Occupancy rates
- Revenue per available night
- Seasonal demand patterns
- Competition analysis (number of listings by area)
- Guest review score averages
11.8 Investment Analysis
Navigate to Dashboard > Analytics > Market > Investments.
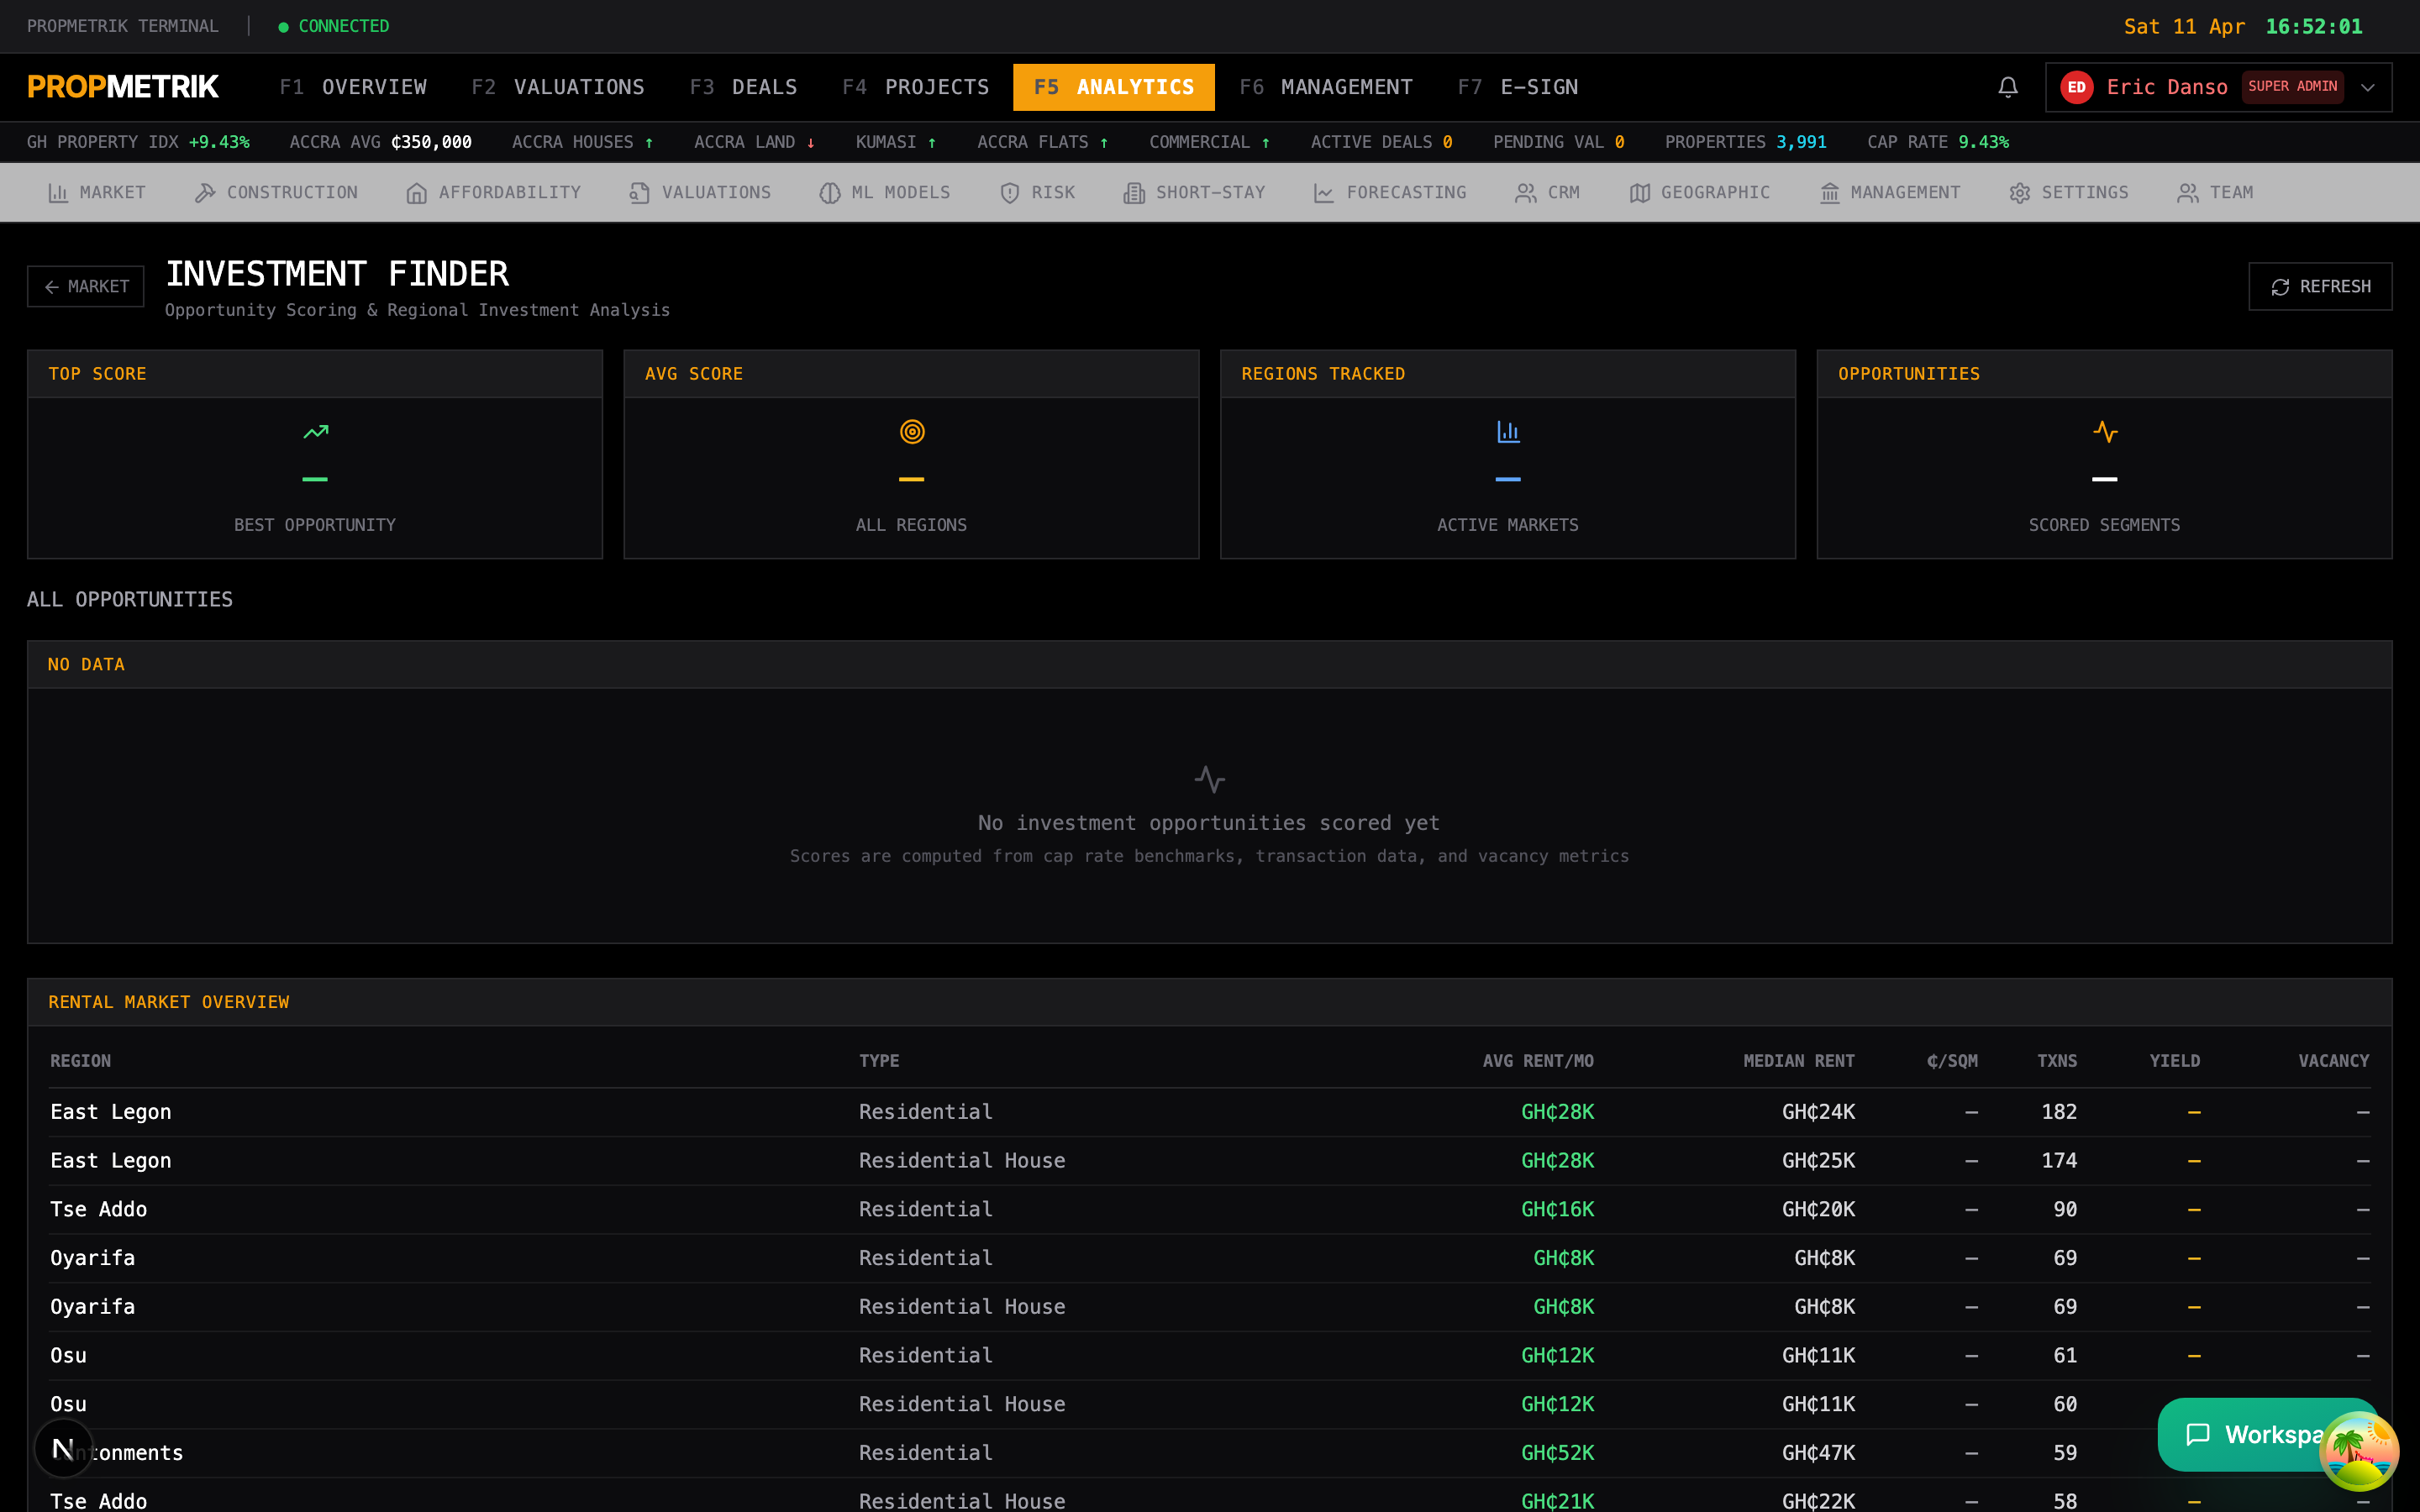
- Gross and net yield calculations by region
- Capitalisation rates
- Cash-on-cash return projections
- Break-even analysis
- Comparative investment scoring
- Buy vs. rent decision framework
11.9 Rental Market Analysis
Navigate to Dashboard > Analytics > Market > Rentals.
- Median rent by region and property type
- Rental yield trends
- Vacancy rates
- Rent growth year-over-year
- Landlord return analysis
- Rental demand indicators
11.10 ML Insights Dashboard
Navigate to Dashboard > Analytics > ML.
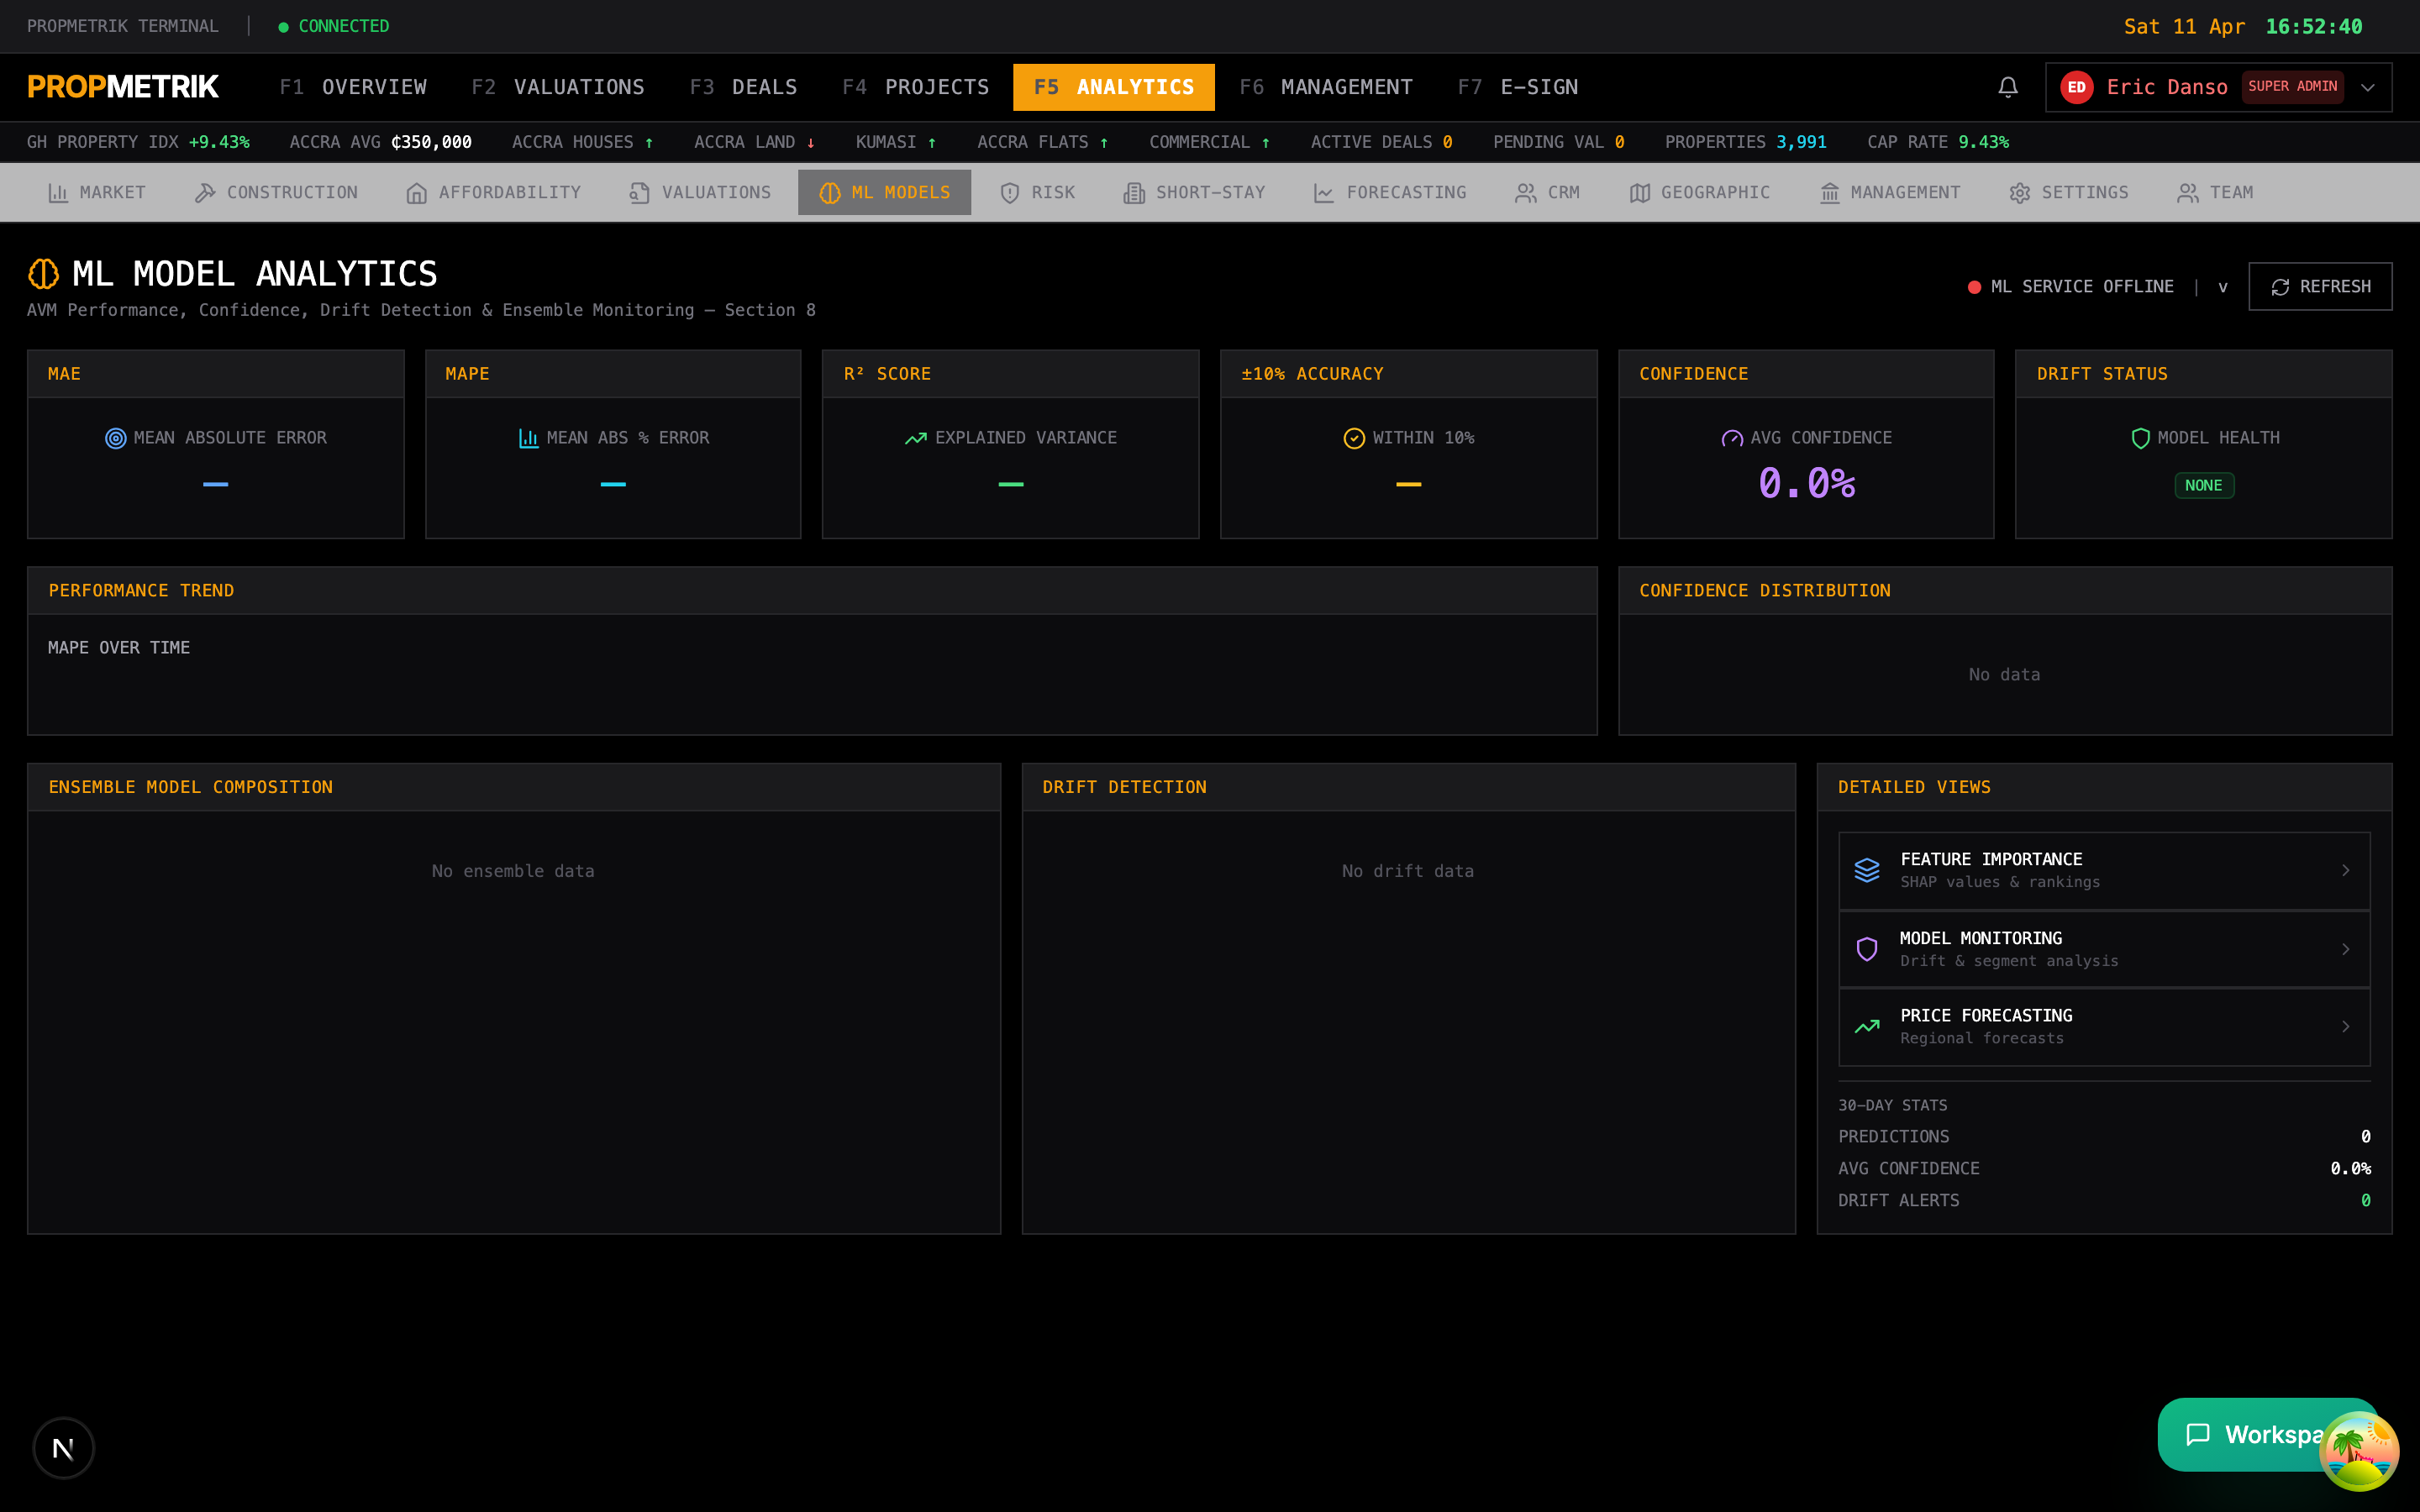
The ML (Machine Learning) dashboard provides transparency into the predictive models powering PROPMETRIK's analytics.
Service Status
- ML service status (online/offline)
- Model version in production
- Total predictions in the last 30 days
- Average confidence score
- Active drift alerts
Model Performance Metrics
| Metric | Description |
|---|---|
| MAE | Mean Absolute Error -- average prediction error in GH₵ |
| RMSE | Root Mean Squared Error -- penalises large errors more |
| MAPE | Mean Absolute Percentage Error |
| R-squared | Proportion of variance explained (closer to 1.0 is better) |
| Median Error | Middle error value |
| P90 Error | 90th percentile error (worst 10% of predictions) |
| Within 10% | Percentage of predictions within 10% of actual values |
| Within 20% | Percentage of predictions within 20% of actual values |
Ensemble Analytics
PROPMETRIK uses an ensemble of multiple models. The dashboard shows:
- Individual model weights
- Model agreement scores
- Ensemble vs. individual model performance
11.11 ML Feature Importance
Navigate to Dashboard > Analytics > ML > Features.
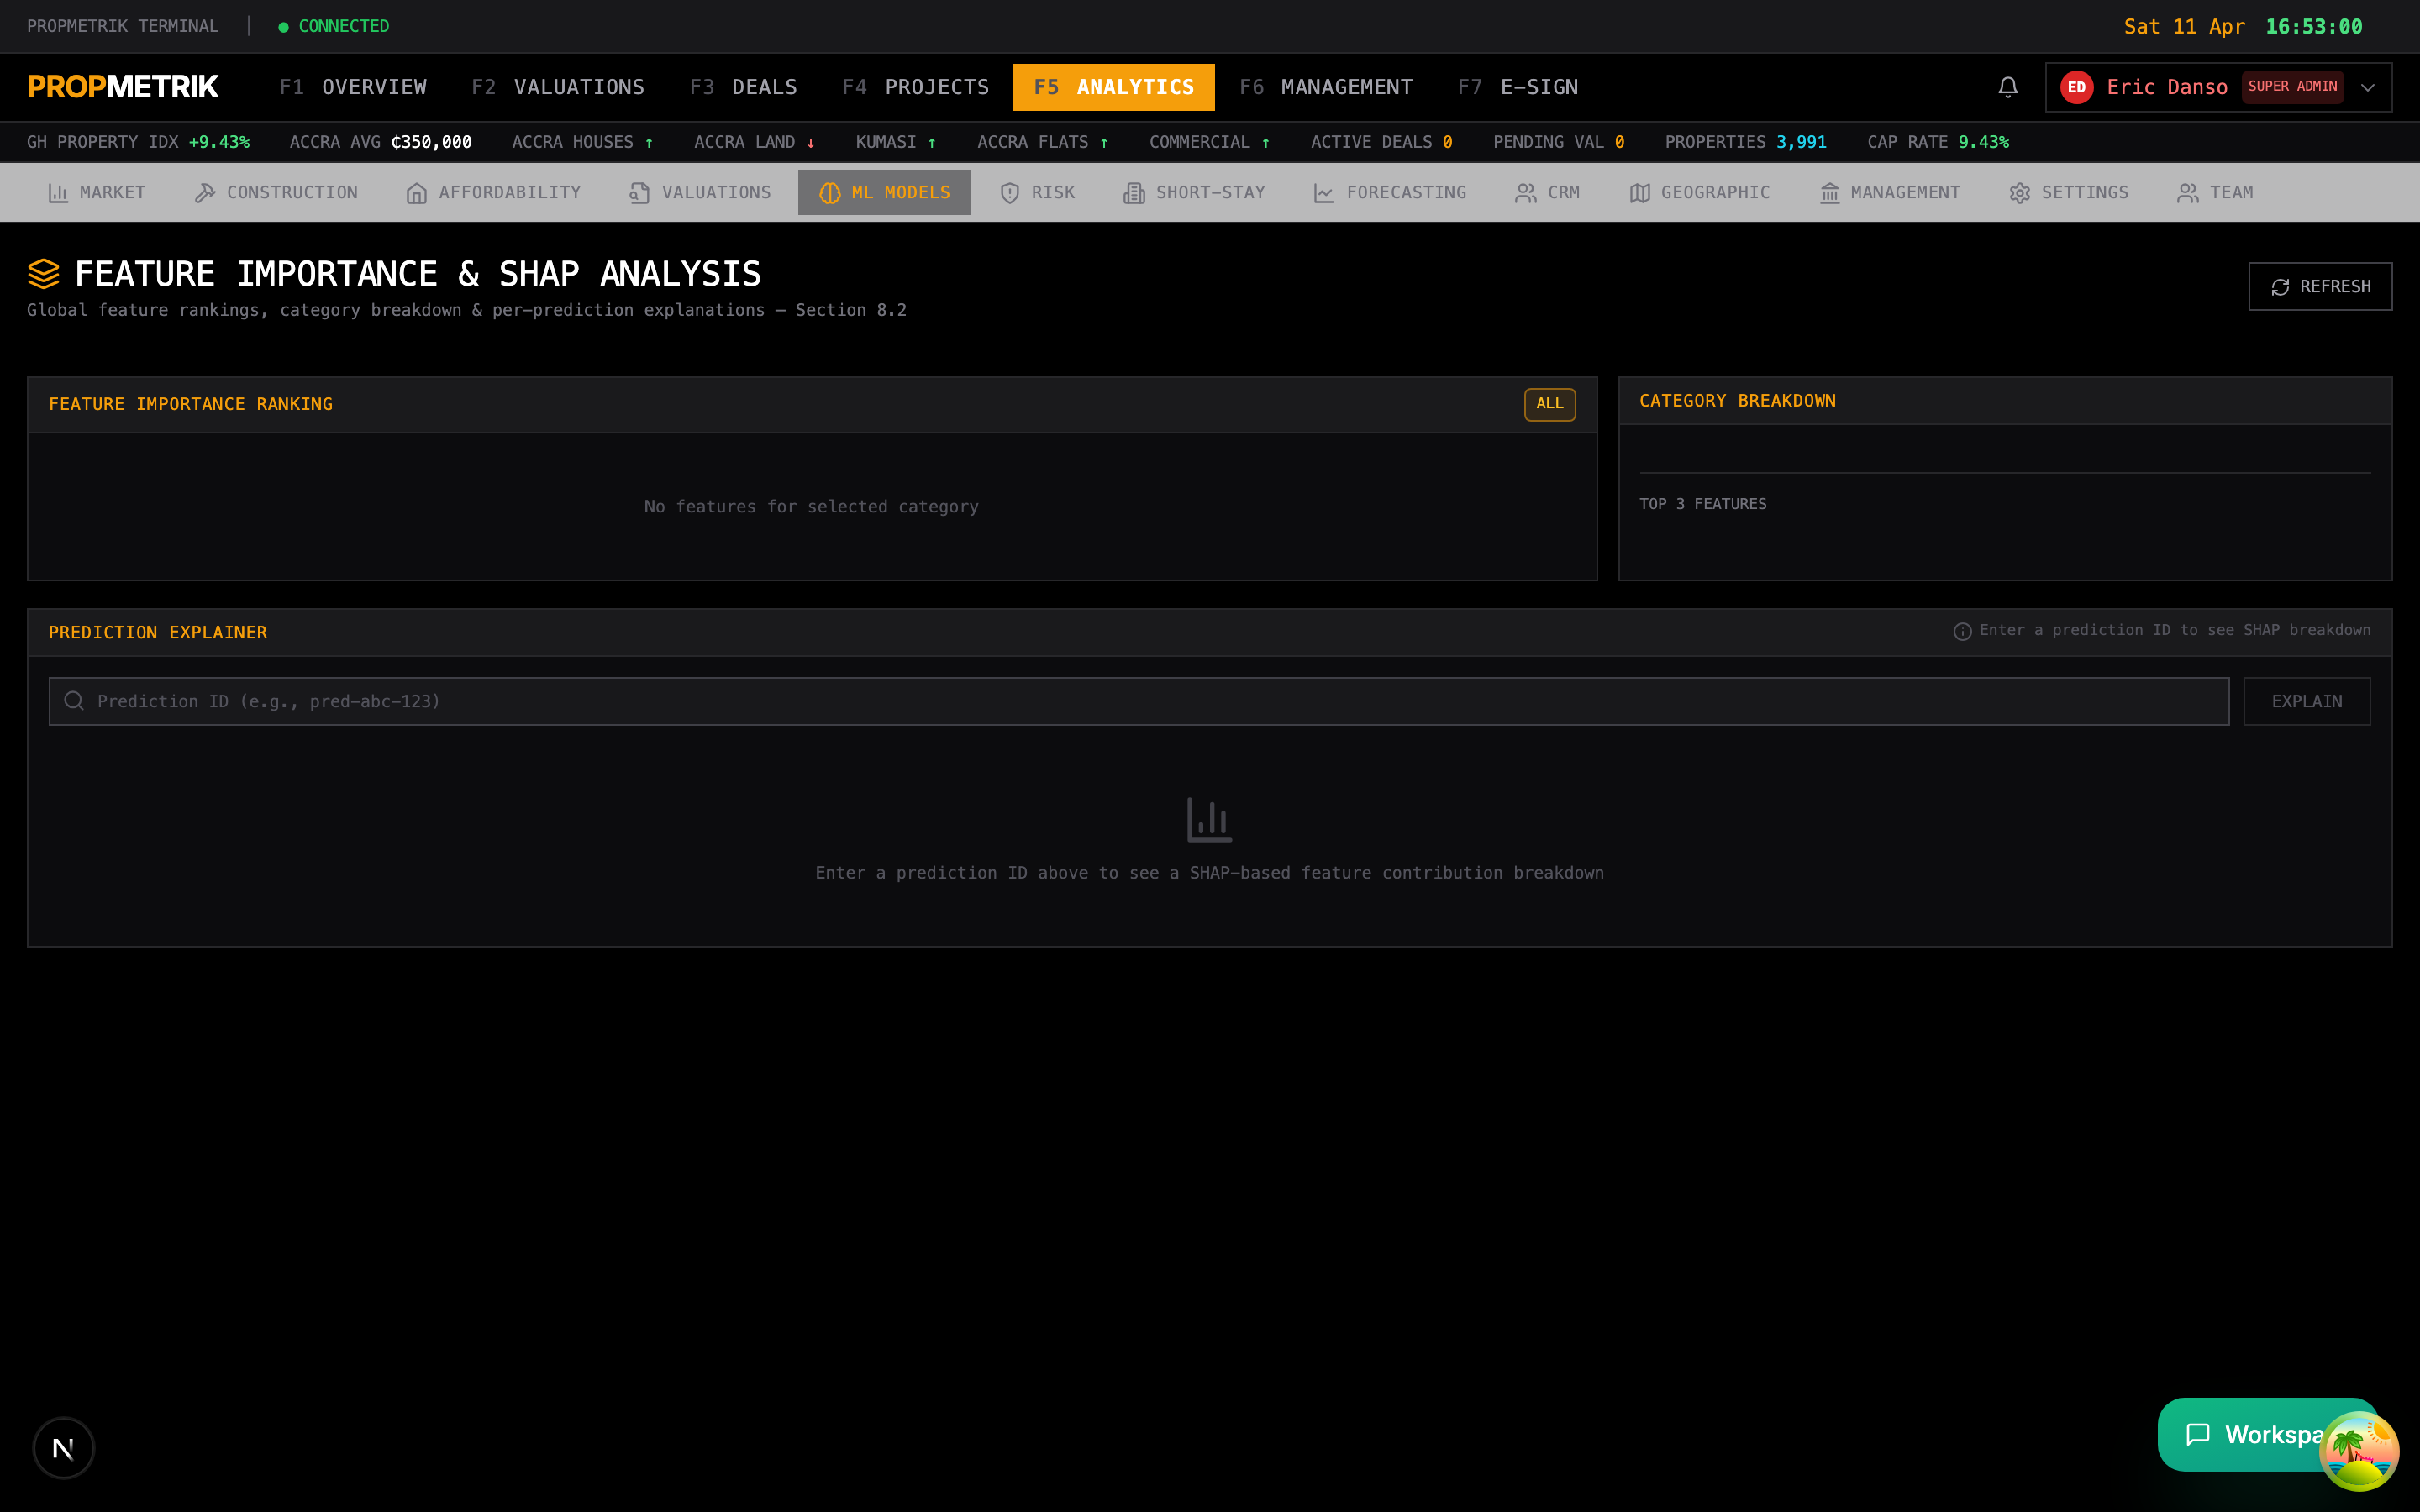
- Ranked list of features (inputs) used by the valuation model
- Feature importance scores
- SHAP (Shapley) values showing how each feature pushes predictions up or down
- Feature distribution histograms
- Correlation matrix between key features
11.12 ML Forecasting
Navigate to Dashboard > Analytics > ML > Forecasting.
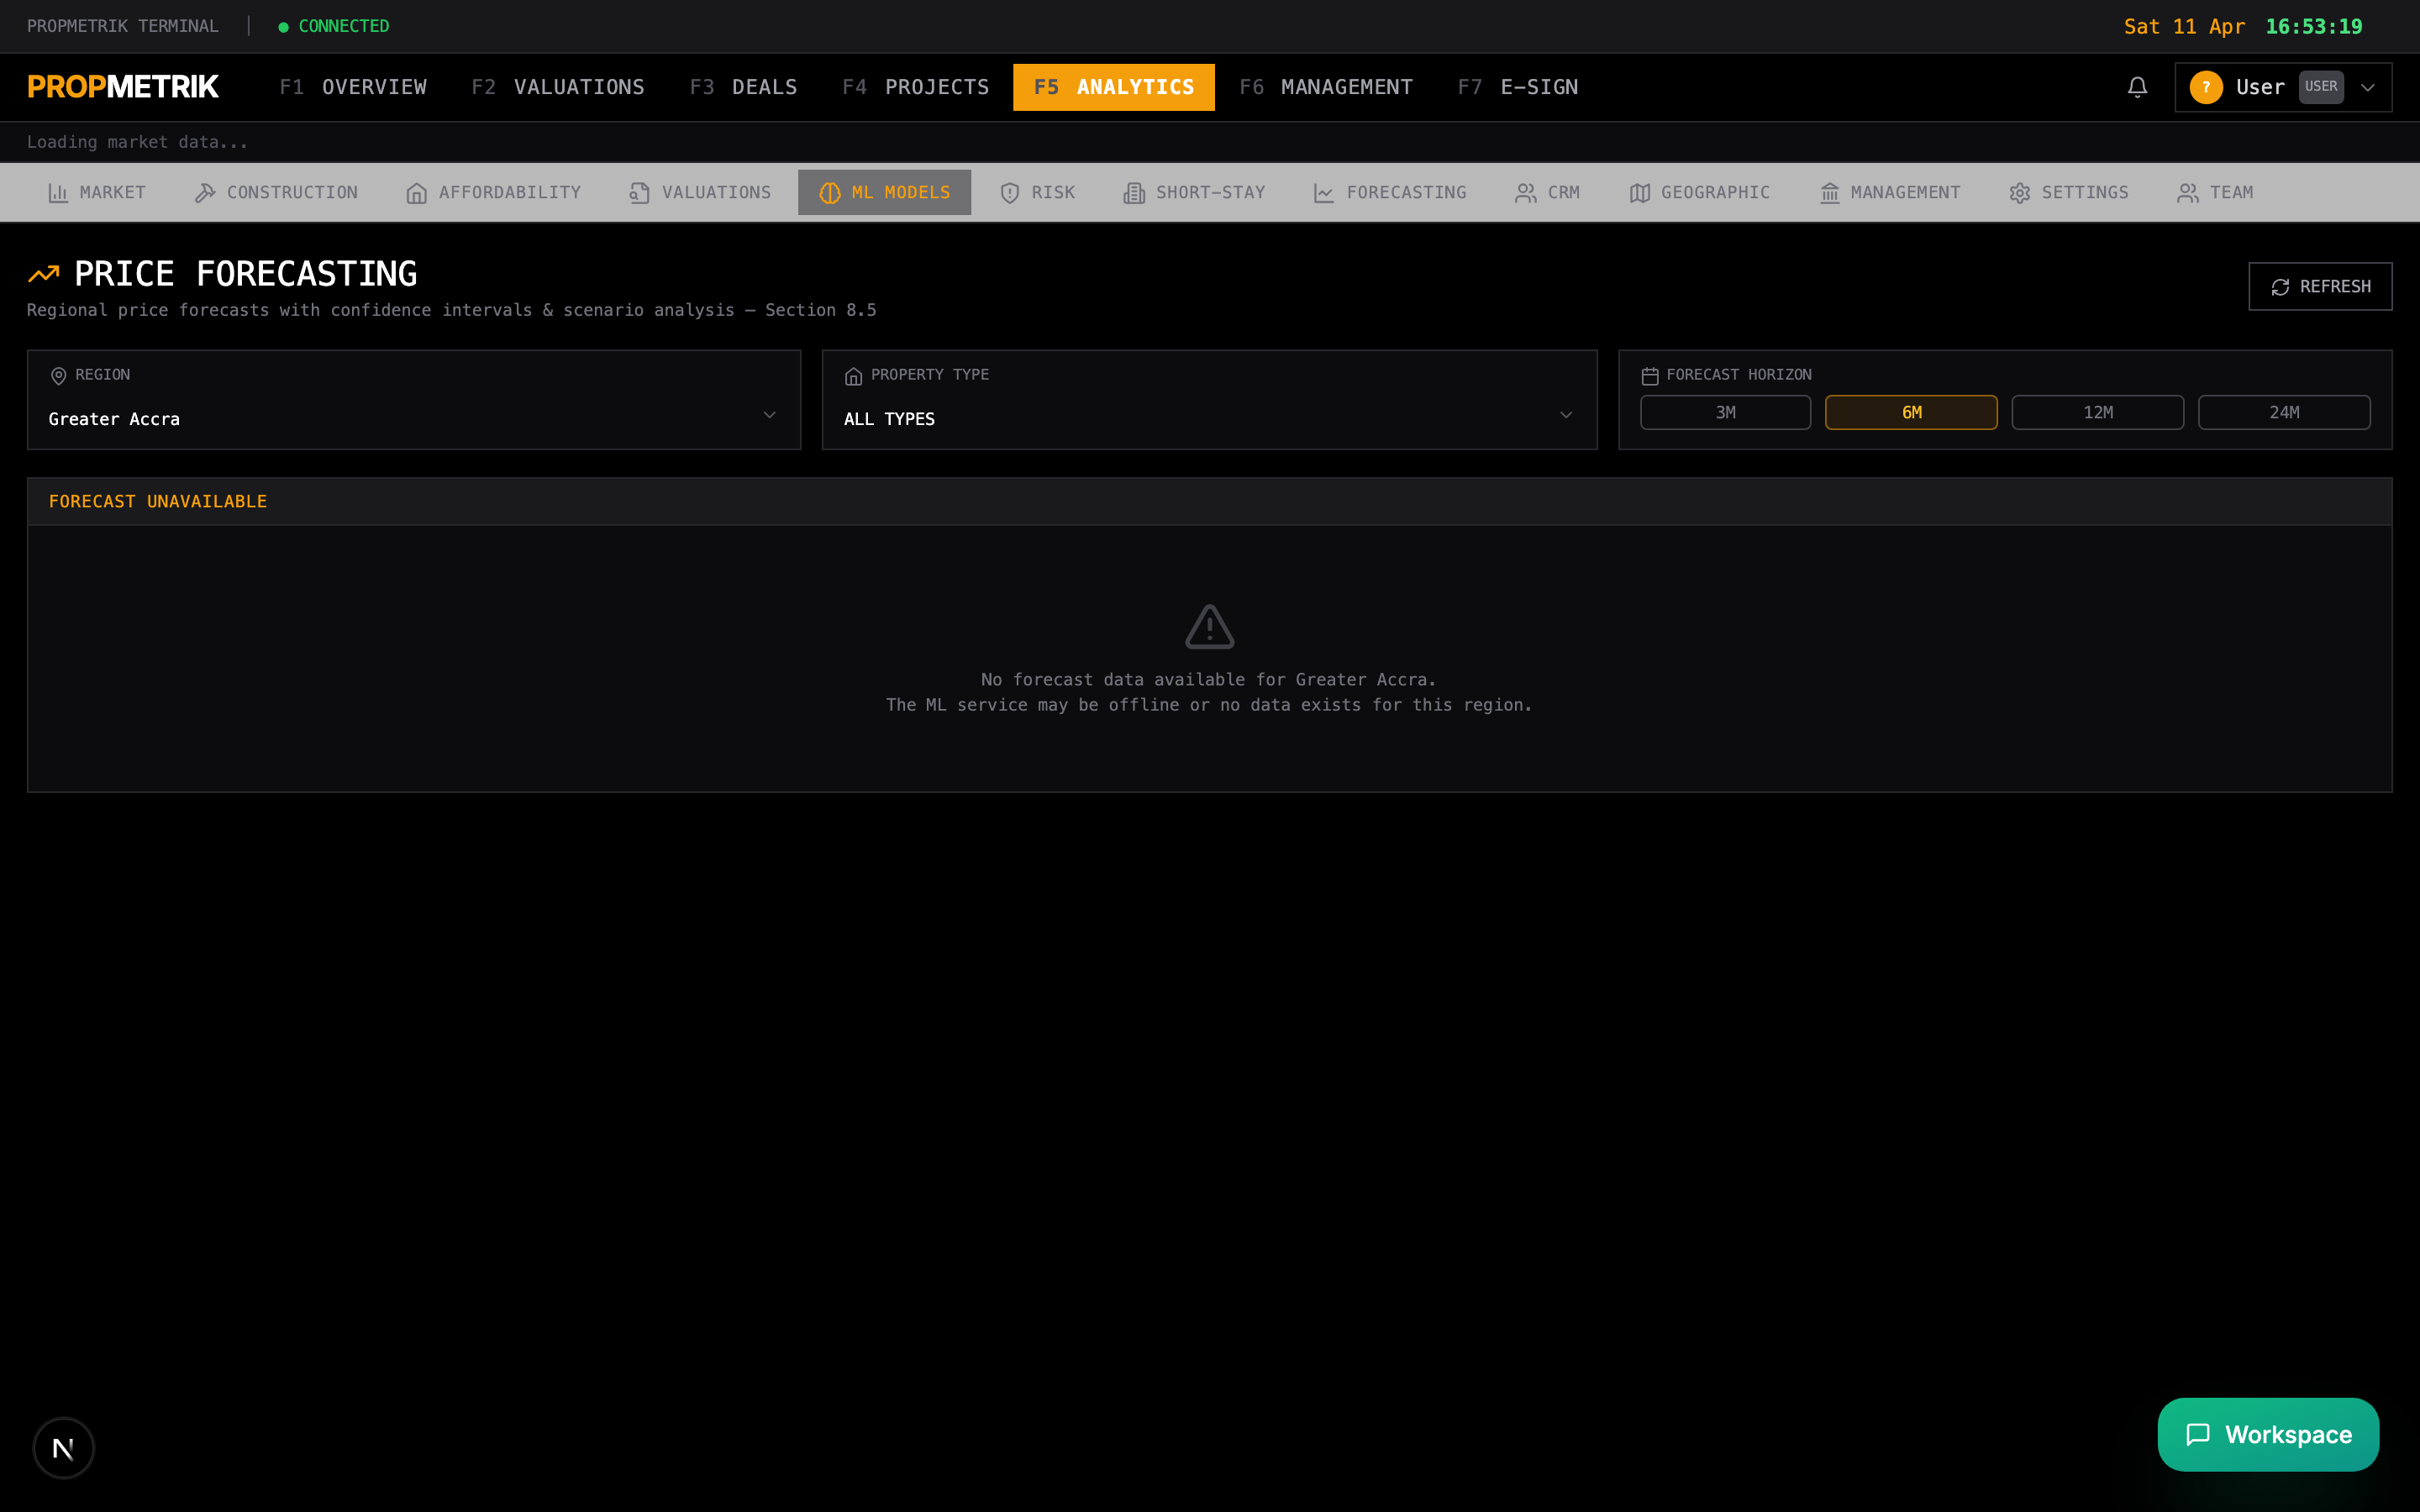
- Property value time-series forecasts
- Confidence bands (narrow = high confidence, wide = uncertain)
- Historical accuracy tracking
- Model comparison (which model performed best by region/property type)
11.13 ML Model Monitoring
Navigate to Dashboard > Analytics > ML > Monitoring.
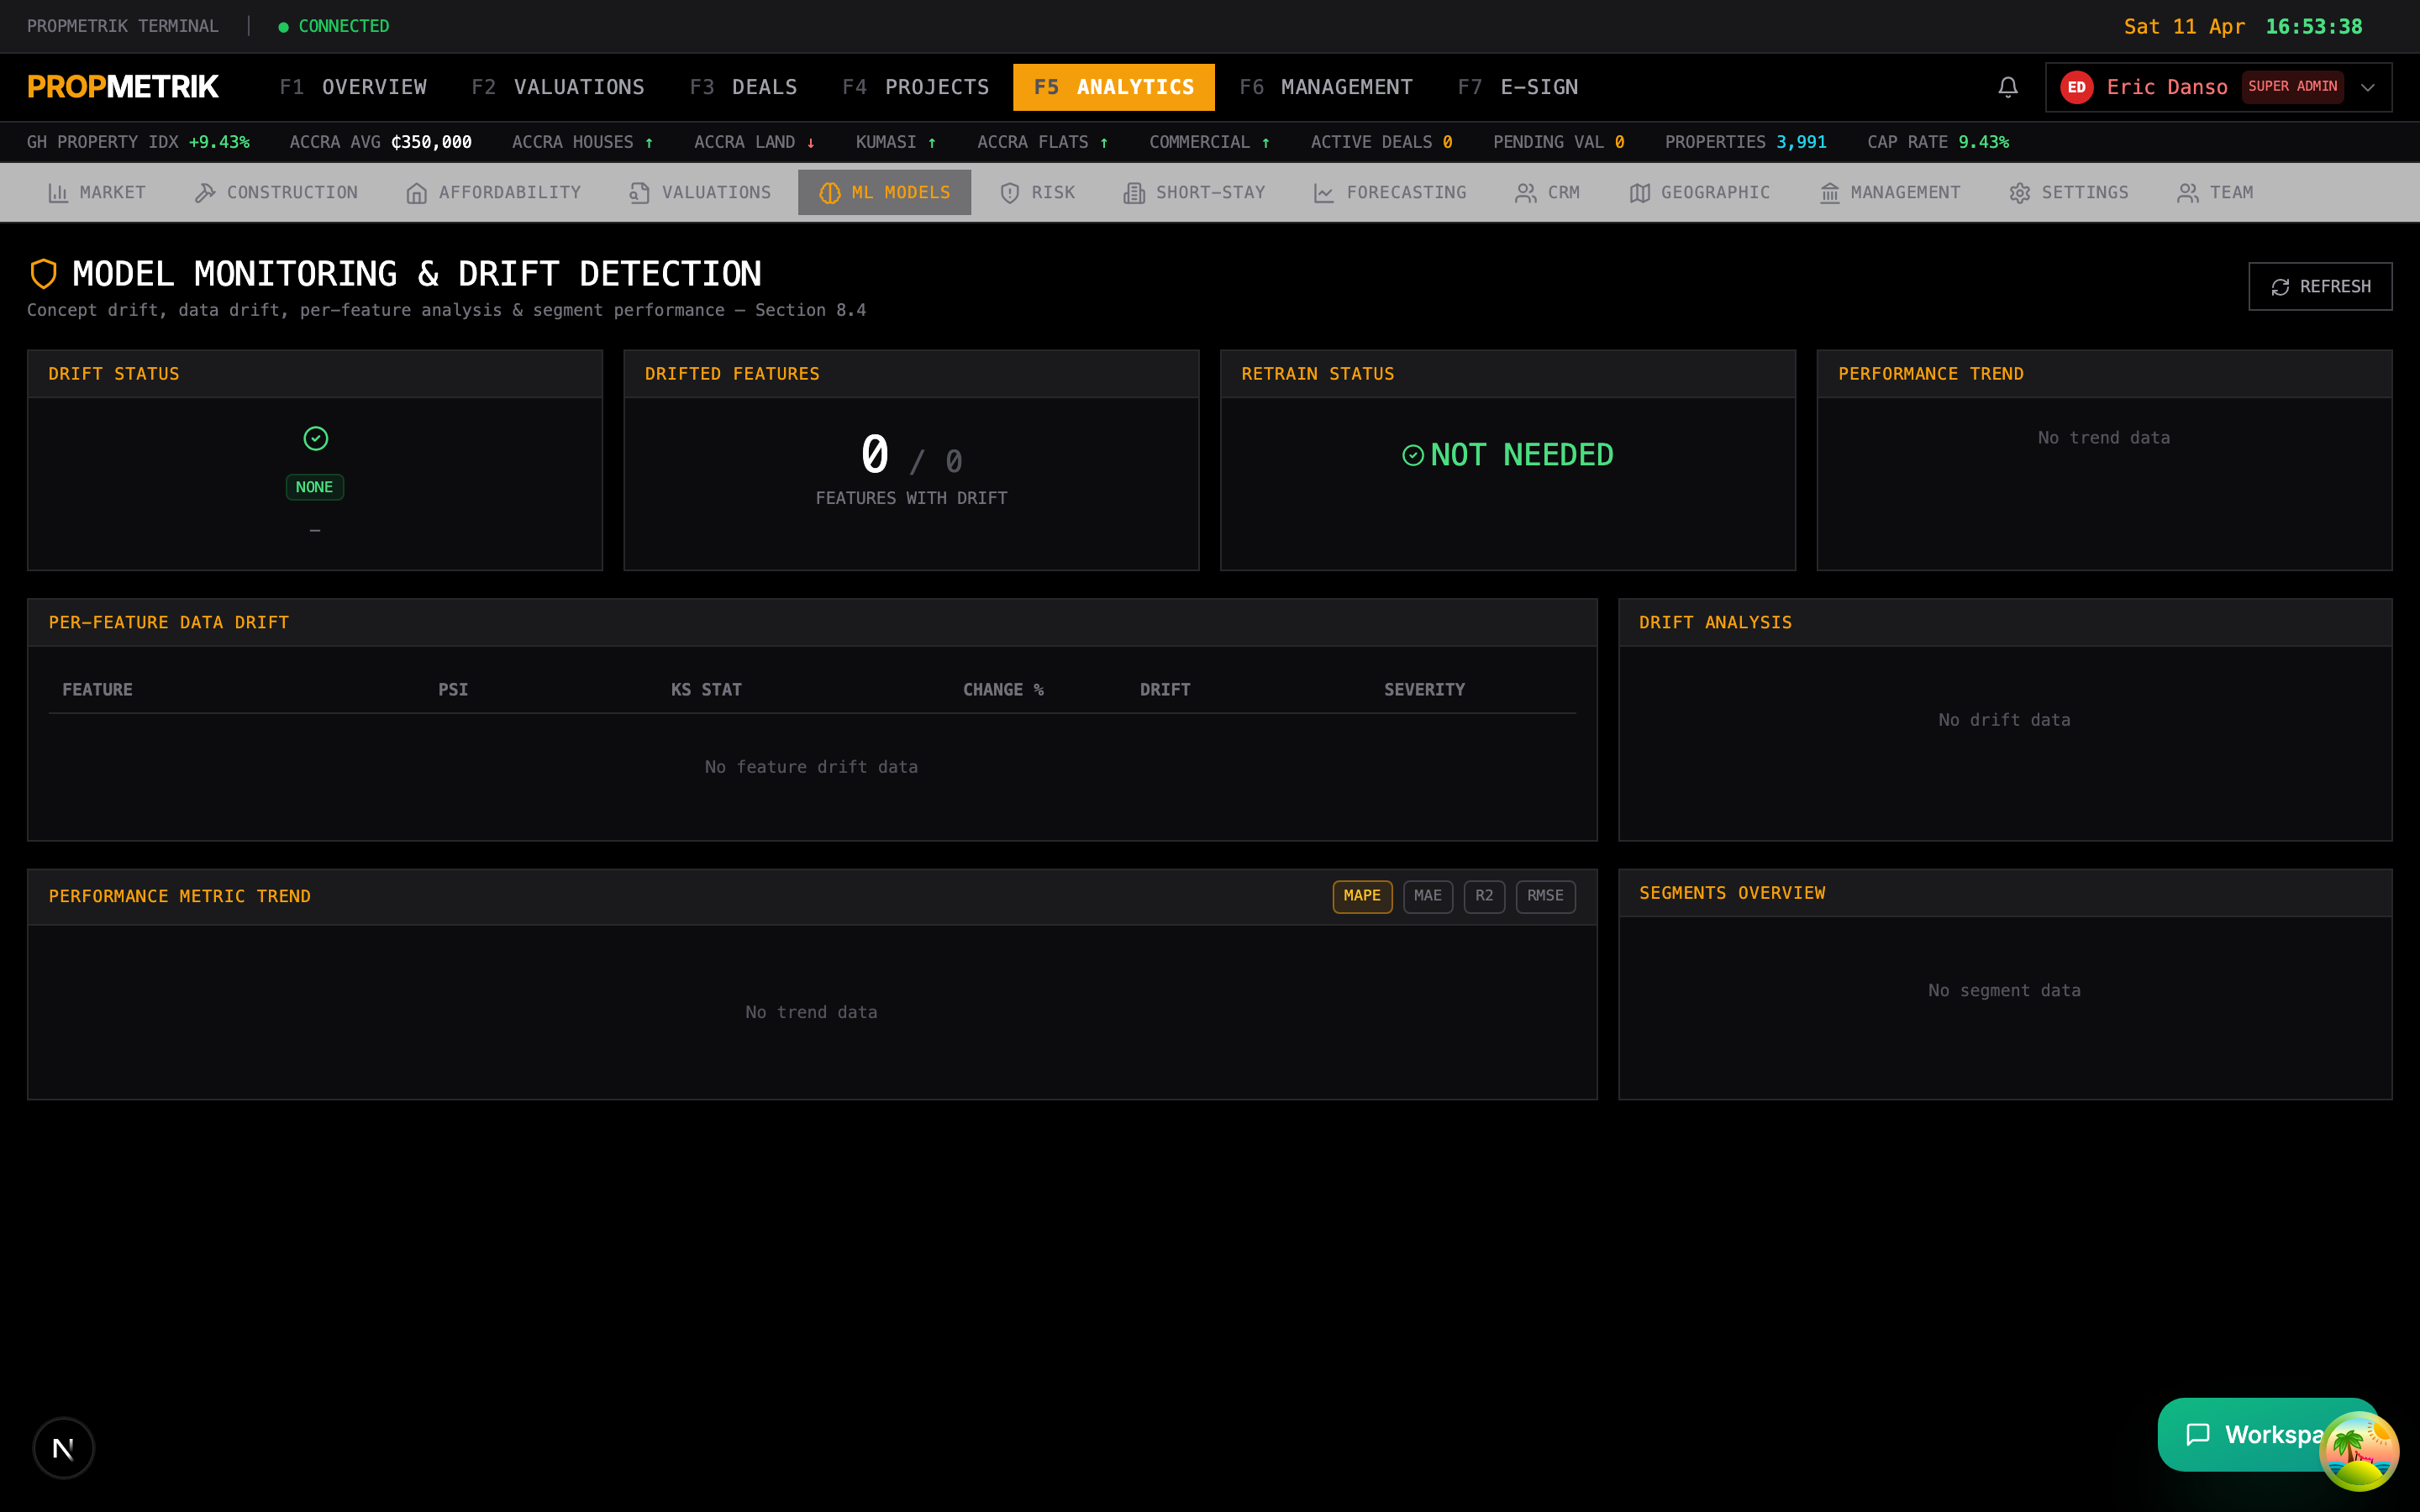
Drift Detection
Monitors whether the model's input data distribution has shifted:
- Concept Drift -- the relationship between inputs and outputs has changed.
- Data Drift -- the distribution of incoming data has shifted.
- Prediction Drift -- model outputs are systematically different from expectations.
Each drift alert includes:
- Detection date
- Drift type and severity
- Affected metrics
- Recommendation (retrain, monitor, or no action)
- Whether retraining is required
Performance Trends
Track how model accuracy changes over time:
- Trend direction (improving, degrading, stable)
- Change rate
- Historical performance charts
Confidence Distribution
- Histogram of prediction confidence scores
- High/medium/low confidence breakdown
- Mean and median confidence over time
Part B: Data Hub Administration
11.14 Data Hub Overview
Navigate to Dashboard > Admin > Data Hub for the administration dashboard.
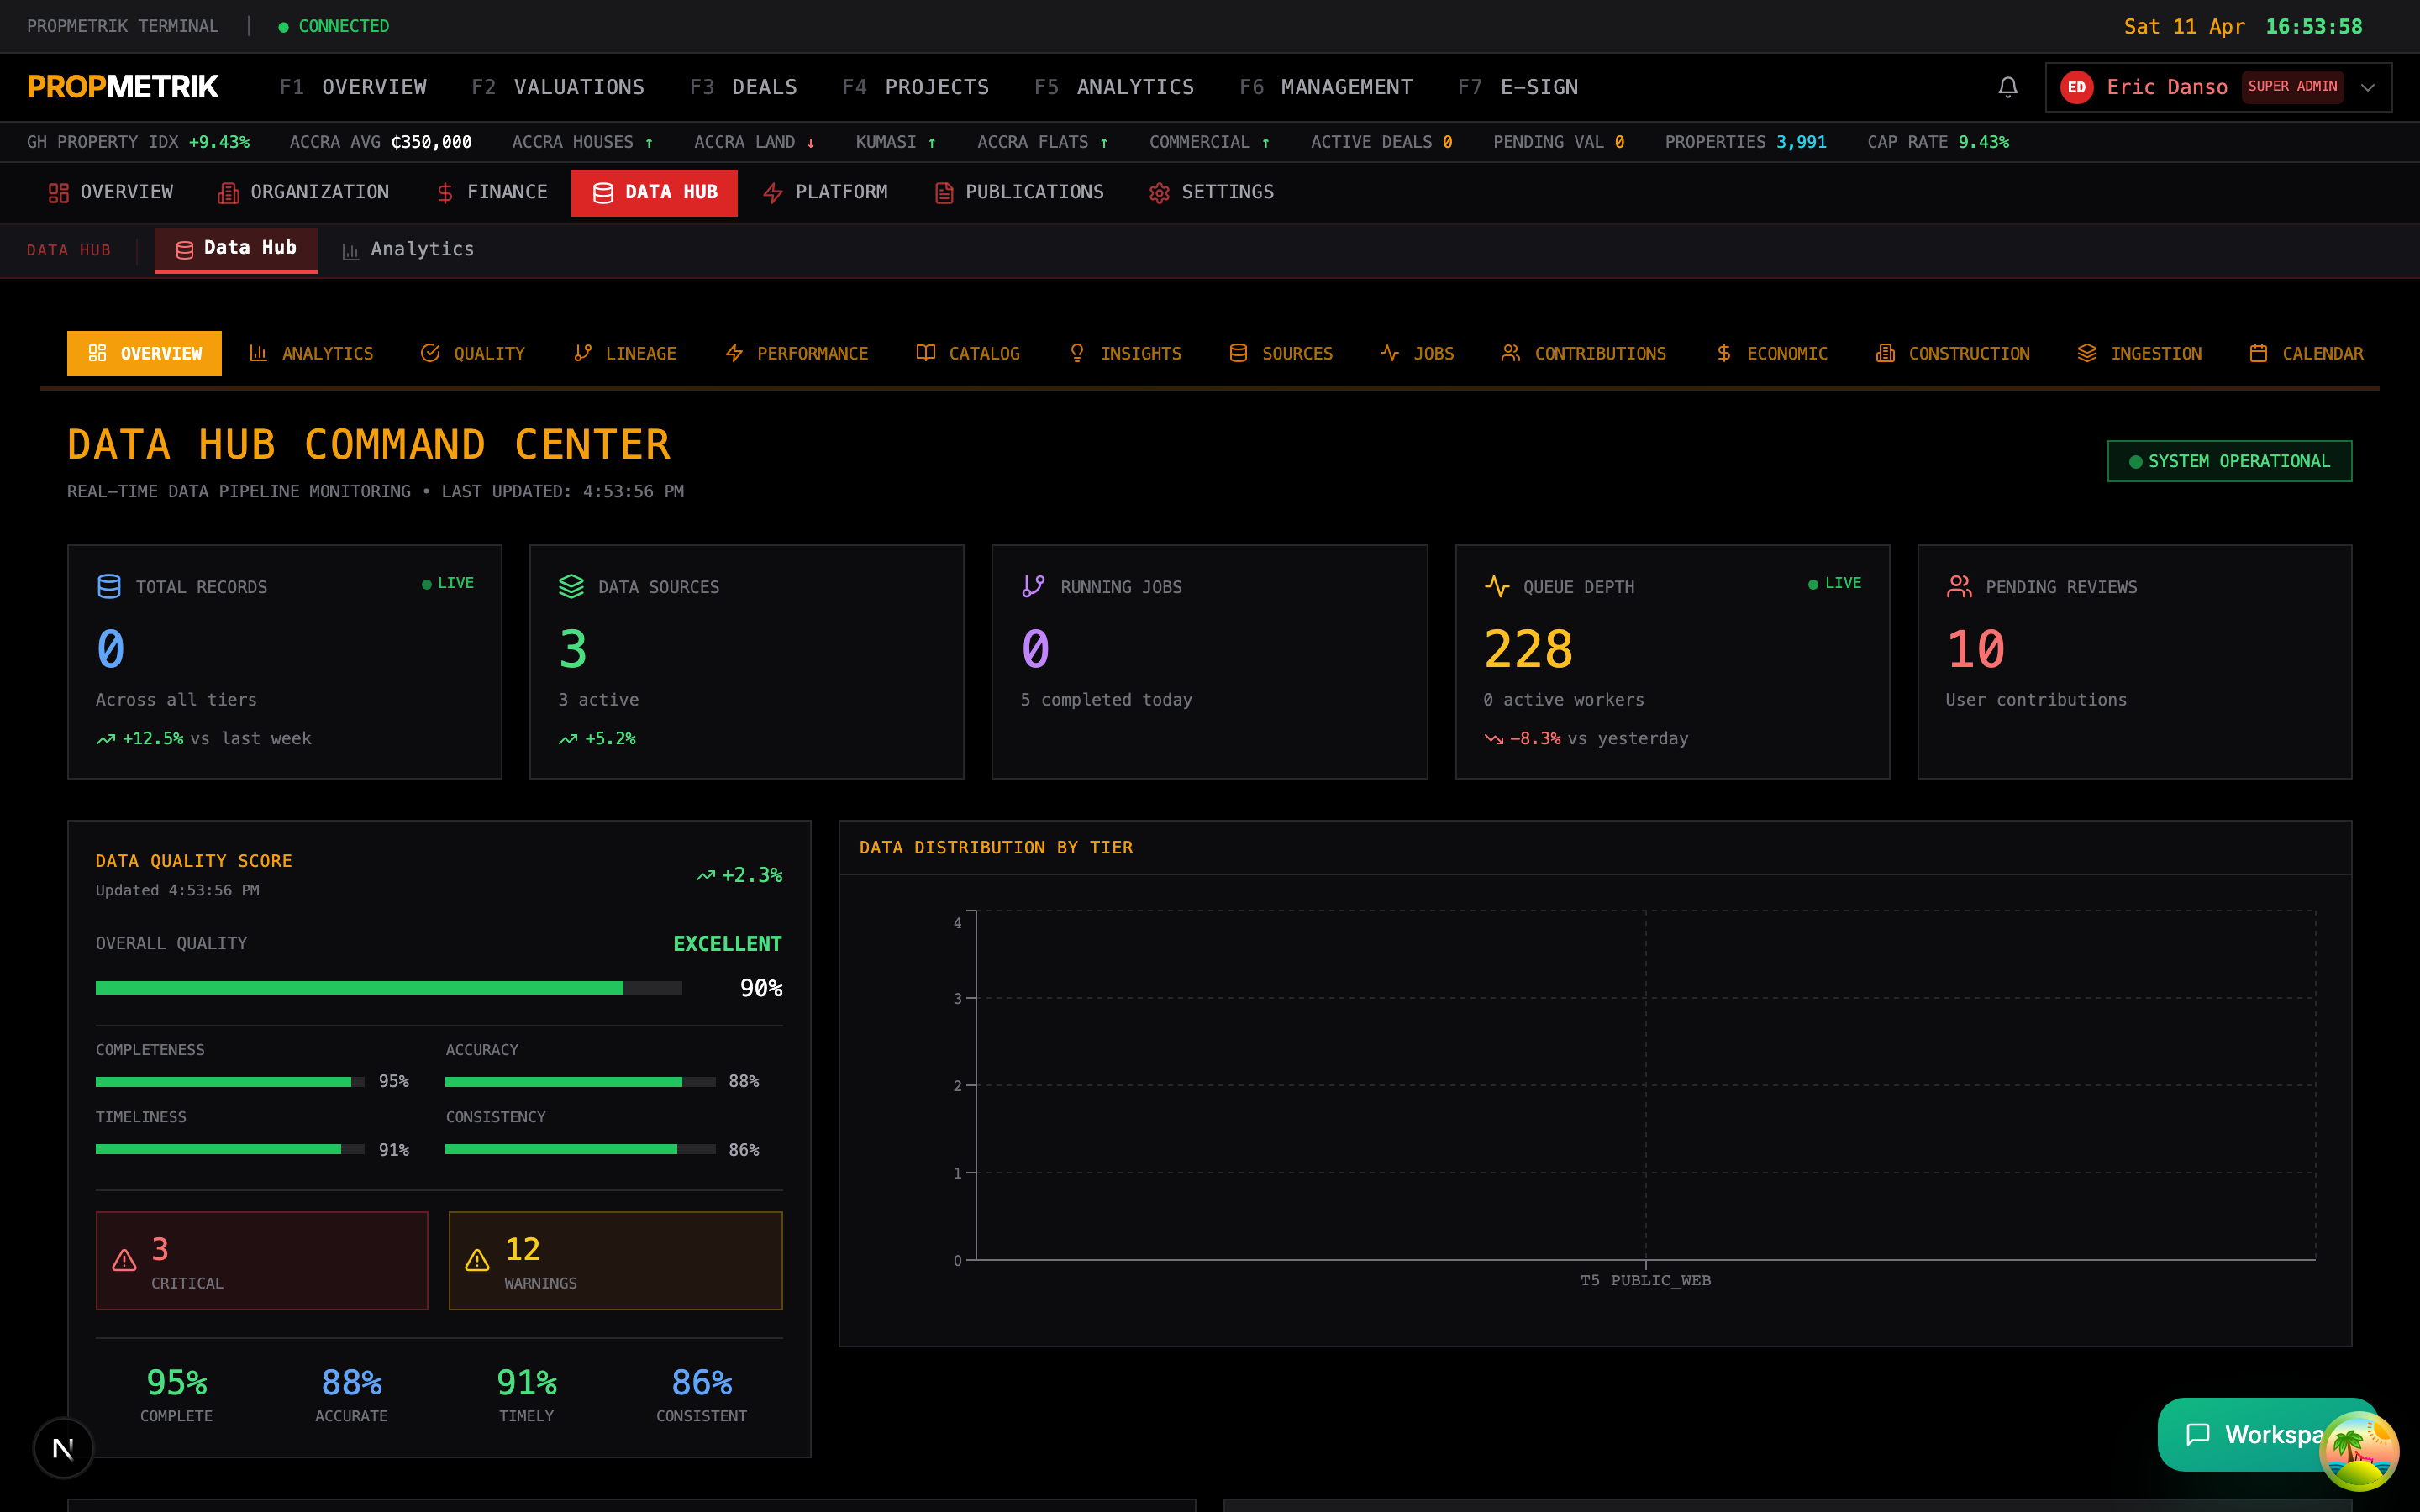
The Data Hub overview displays:
- Source Statistics -- total data sources by tier, active vs. paused.
- ETL Job Status -- running, queued, completed, and failed jobs.
- Pending Contributions -- community-submitted data awaiting review.
- Economic Snapshot -- latest macro-economic indicators.
- Data Quality Widget -- overall quality scores and alerts.
- Real-Time Data Feed -- live stream of incoming data events.
- System Health -- server status, queue depths, processing rates.
Data Source Tiers
PROPMETRIK organises data sources into five tiers based on reliability:
| Tier | Name | Examples | Colour |
|---|---|---|---|
| Tier 1 | Government | Lands Commission, Ghana Statistical Service | Blue |
| Tier 2 | Financial | Banks, mortgage providers, insurance companies | Green |
| Tier 3 | Partners | Estate agents, developers, professional bodies | Purple |
| Tier 4 | Contributions | User-submitted transactions and market data | Amber |
| Tier 5 | Public Web | Property listing websites, classifieds | Orange |
11.15 Data Sources
Navigate to Admin > Data Hub > Sources.
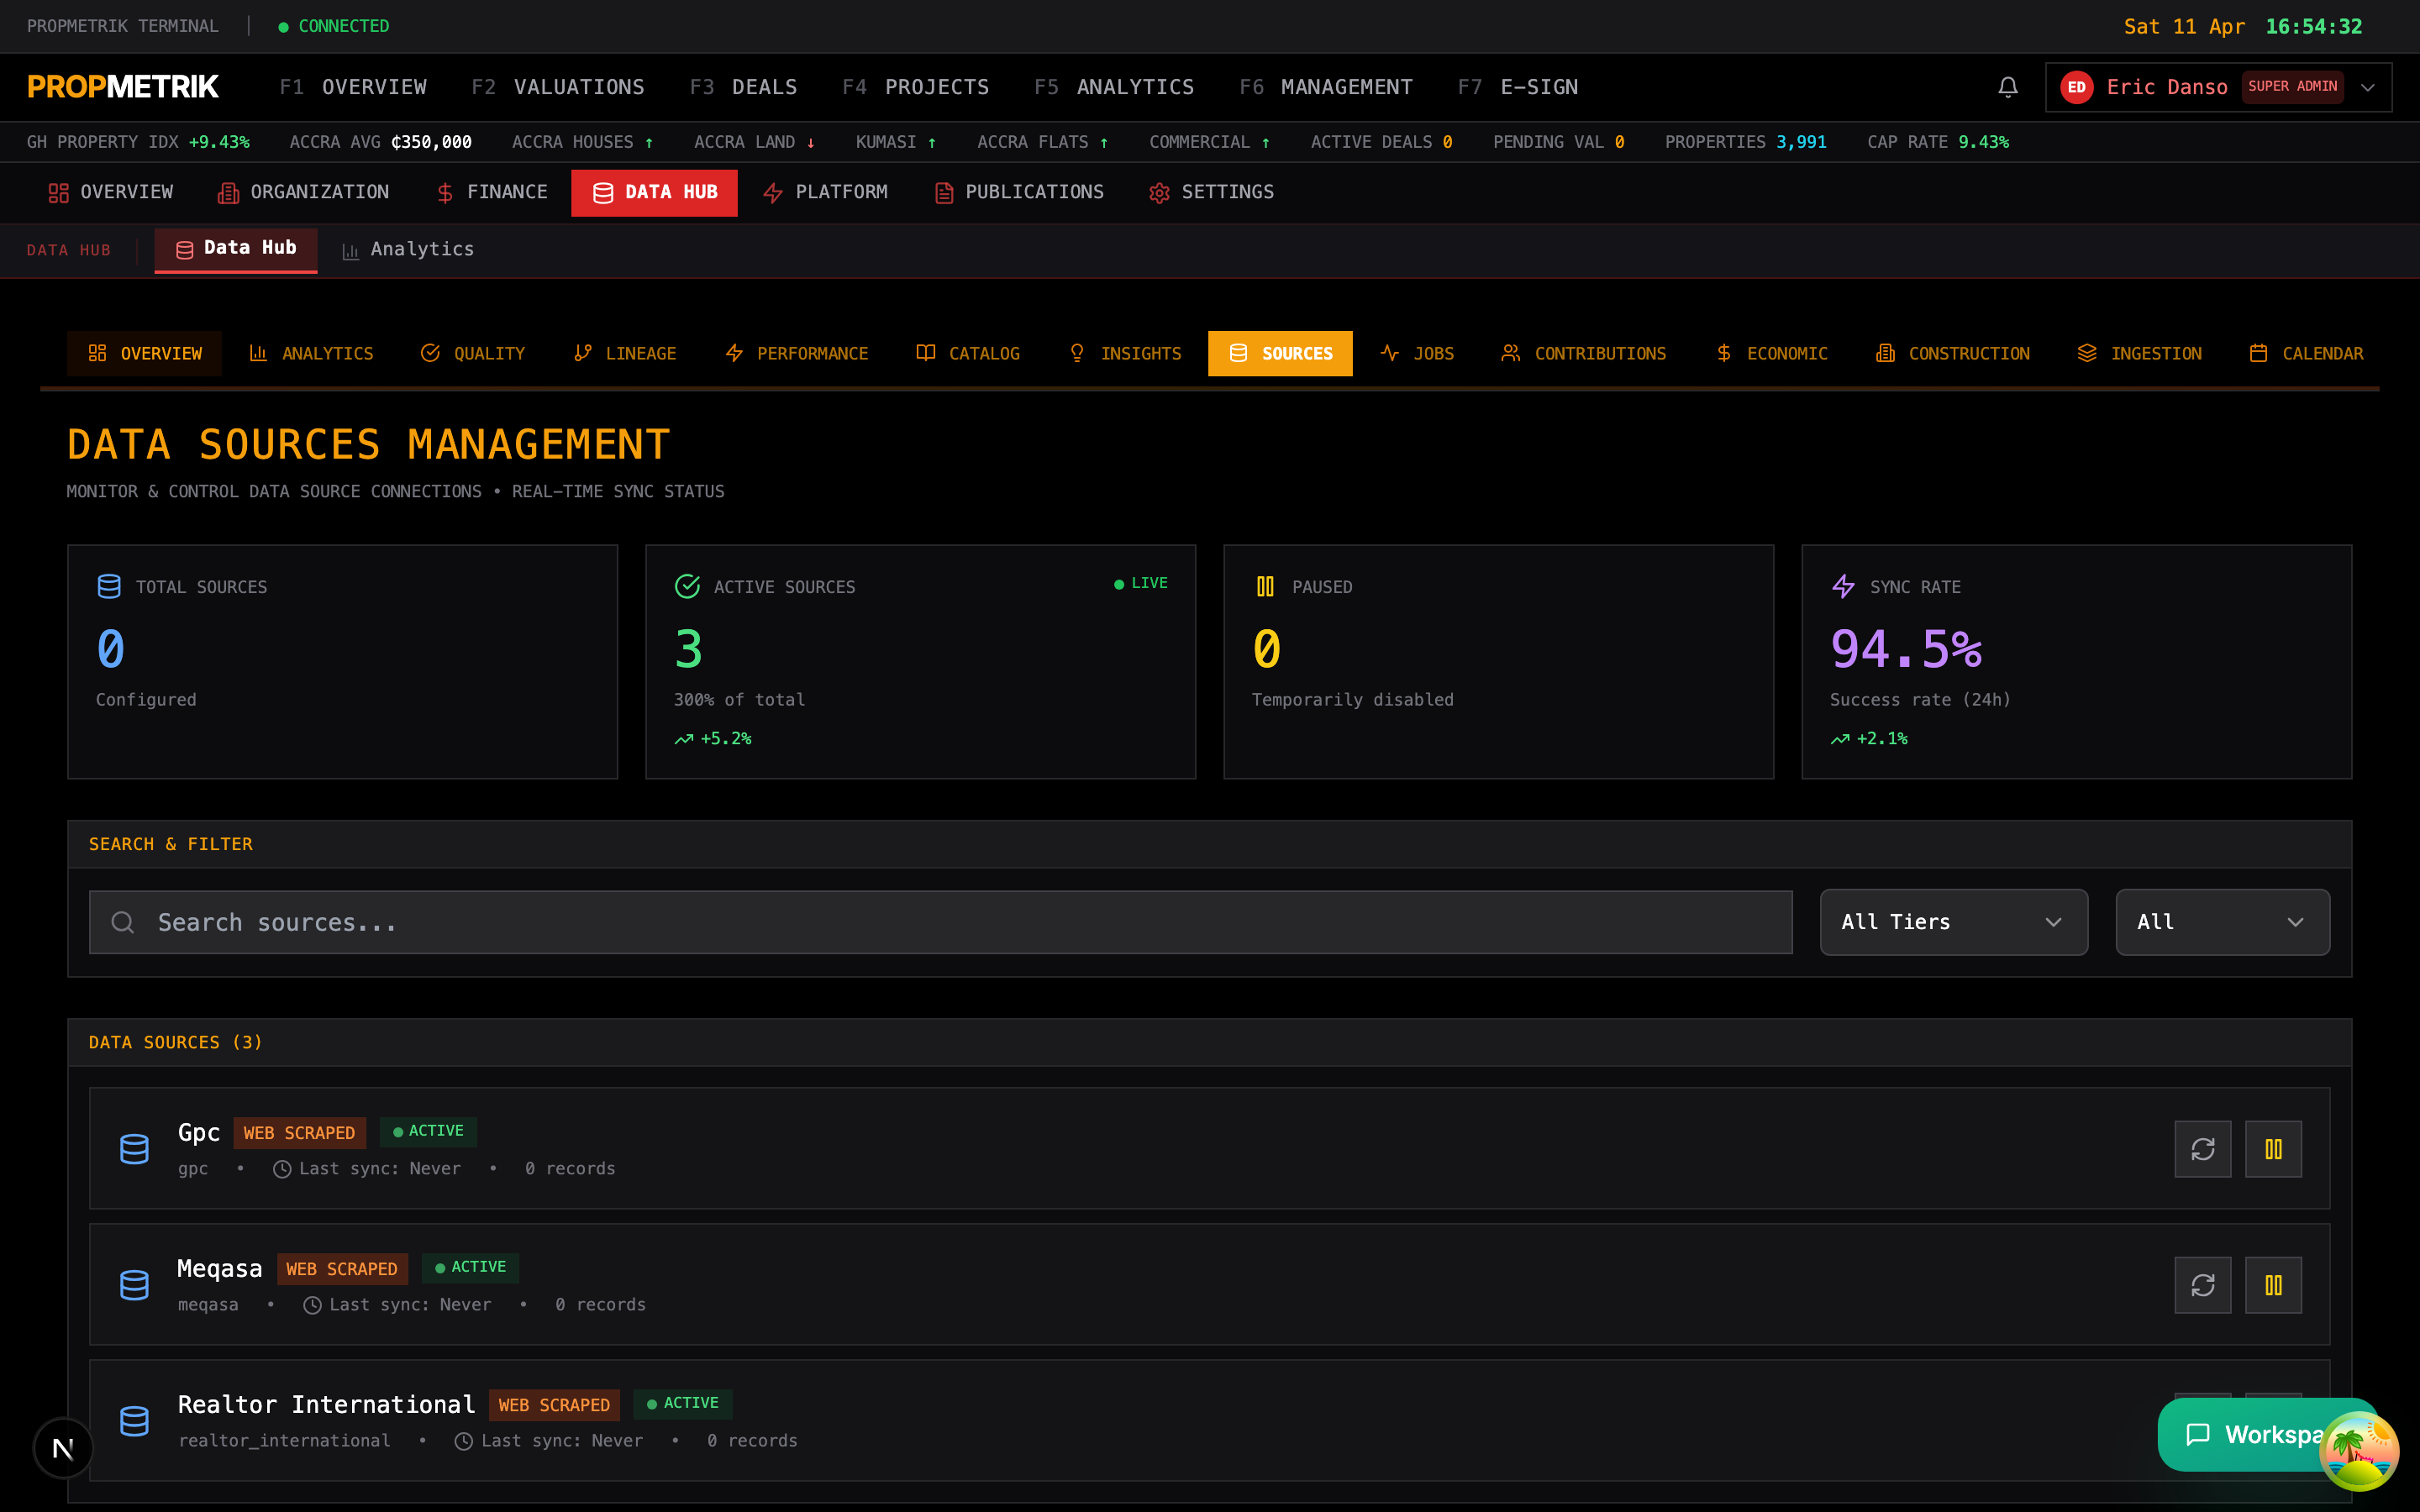
Viewing Sources
The source list shows:
- Source name and description
- Tier badge (colour-coded)
- Status (Active, Paused, Inactive)
- Last sync timestamp
- Record count
- Health indicator (green checkmark, yellow warning, red error)
Filtering
- Search -- find sources by name or description.
- Tier filter -- show only sources of a specific tier.
- Status filter -- filter by Active, Paused, or Inactive.
Source Actions
- Play/Pause -- toggle a source between active and paused states.
- Refresh -- trigger an immediate data pull from the source.
- View Details -- inspect source configuration, API endpoints, and error logs.
11.16 Ingestion
Navigate to Admin > Data Hub > Ingestion.

The ingestion pipeline processes raw data through multiple stages:
- Extract -- pull data from the source (API call, file download, web scrape).
- Transform -- normalise, deduplicate, geocode, and enrich records.
- Validate -- run quality checks (completeness, consistency, accuracy).
- Load -- write validated records to the data warehouse.
The ingestion page shows:
- Pipeline stages with processing counts
- Current throughput (records per minute)
- Error rates per stage
- Queue depth
- Processing latency
11.17 Data Catalog
Navigate to Admin > Data Hub > Catalog.

The data catalog is a searchable registry of all datasets in the platform:
- Dataset name and description
- Schema (columns, data types, constraints)
- Source tier and origin
- Freshness (when last updated)
- Record count
- Usage statistics (which analytics modules reference this dataset)
- Data lineage links
Searching the Catalog
Use the search bar to find datasets by name, column name, or description. Filter by tier or data domain (property, economic, demographic, geographic).
11.18 Data Quality
Navigate to Admin > Data Hub > Quality.

Quality Scores
Each dataset receives a composite quality score based on:
| Dimension | Description |
|---|---|
| Completeness | Percentage of non-null values in required fields |
| Consistency | Cross-field validation (e.g. price > 0 when status = "sold") |
| Accuracy | Spot-check accuracy against verified sources |
| Timeliness | How recent the data is relative to expected refresh cadence |
| Uniqueness | Percentage of non-duplicate records |
Validation Rules
Define custom validation rules for each dataset:
- Click + Add Rule.
- Select the dataset and field.
- Choose the rule type (not null, range, regex, cross-field, custom SQL).
- Set the severity (Error, Warning, Info).
- Click Save.
Issue Tracking
Failed validation rules generate issues that appear in the issues table with:
- Dataset and field affected
- Rule that failed
- Severity
- Record count affected
- First and last occurrence
- Resolution status
11.19 Data Lineage
Navigate to Admin > Data Hub > Lineage.

The lineage view provides a visual graph showing how data flows through the system:
- Source nodes (Tier 1--5)
- ETL transformation steps
- Intermediate datasets
- Final analytical outputs
Click any node to see:
- Input sources
- Transformation logic applied
- Output destinations
- Data freshness at each stage
Tip: Use lineage to debug data issues -- trace a suspicious metric back to its source to identify where the problem originated.
11.20 Data Analytics
Navigate to Admin > Data Hub > Analytics.
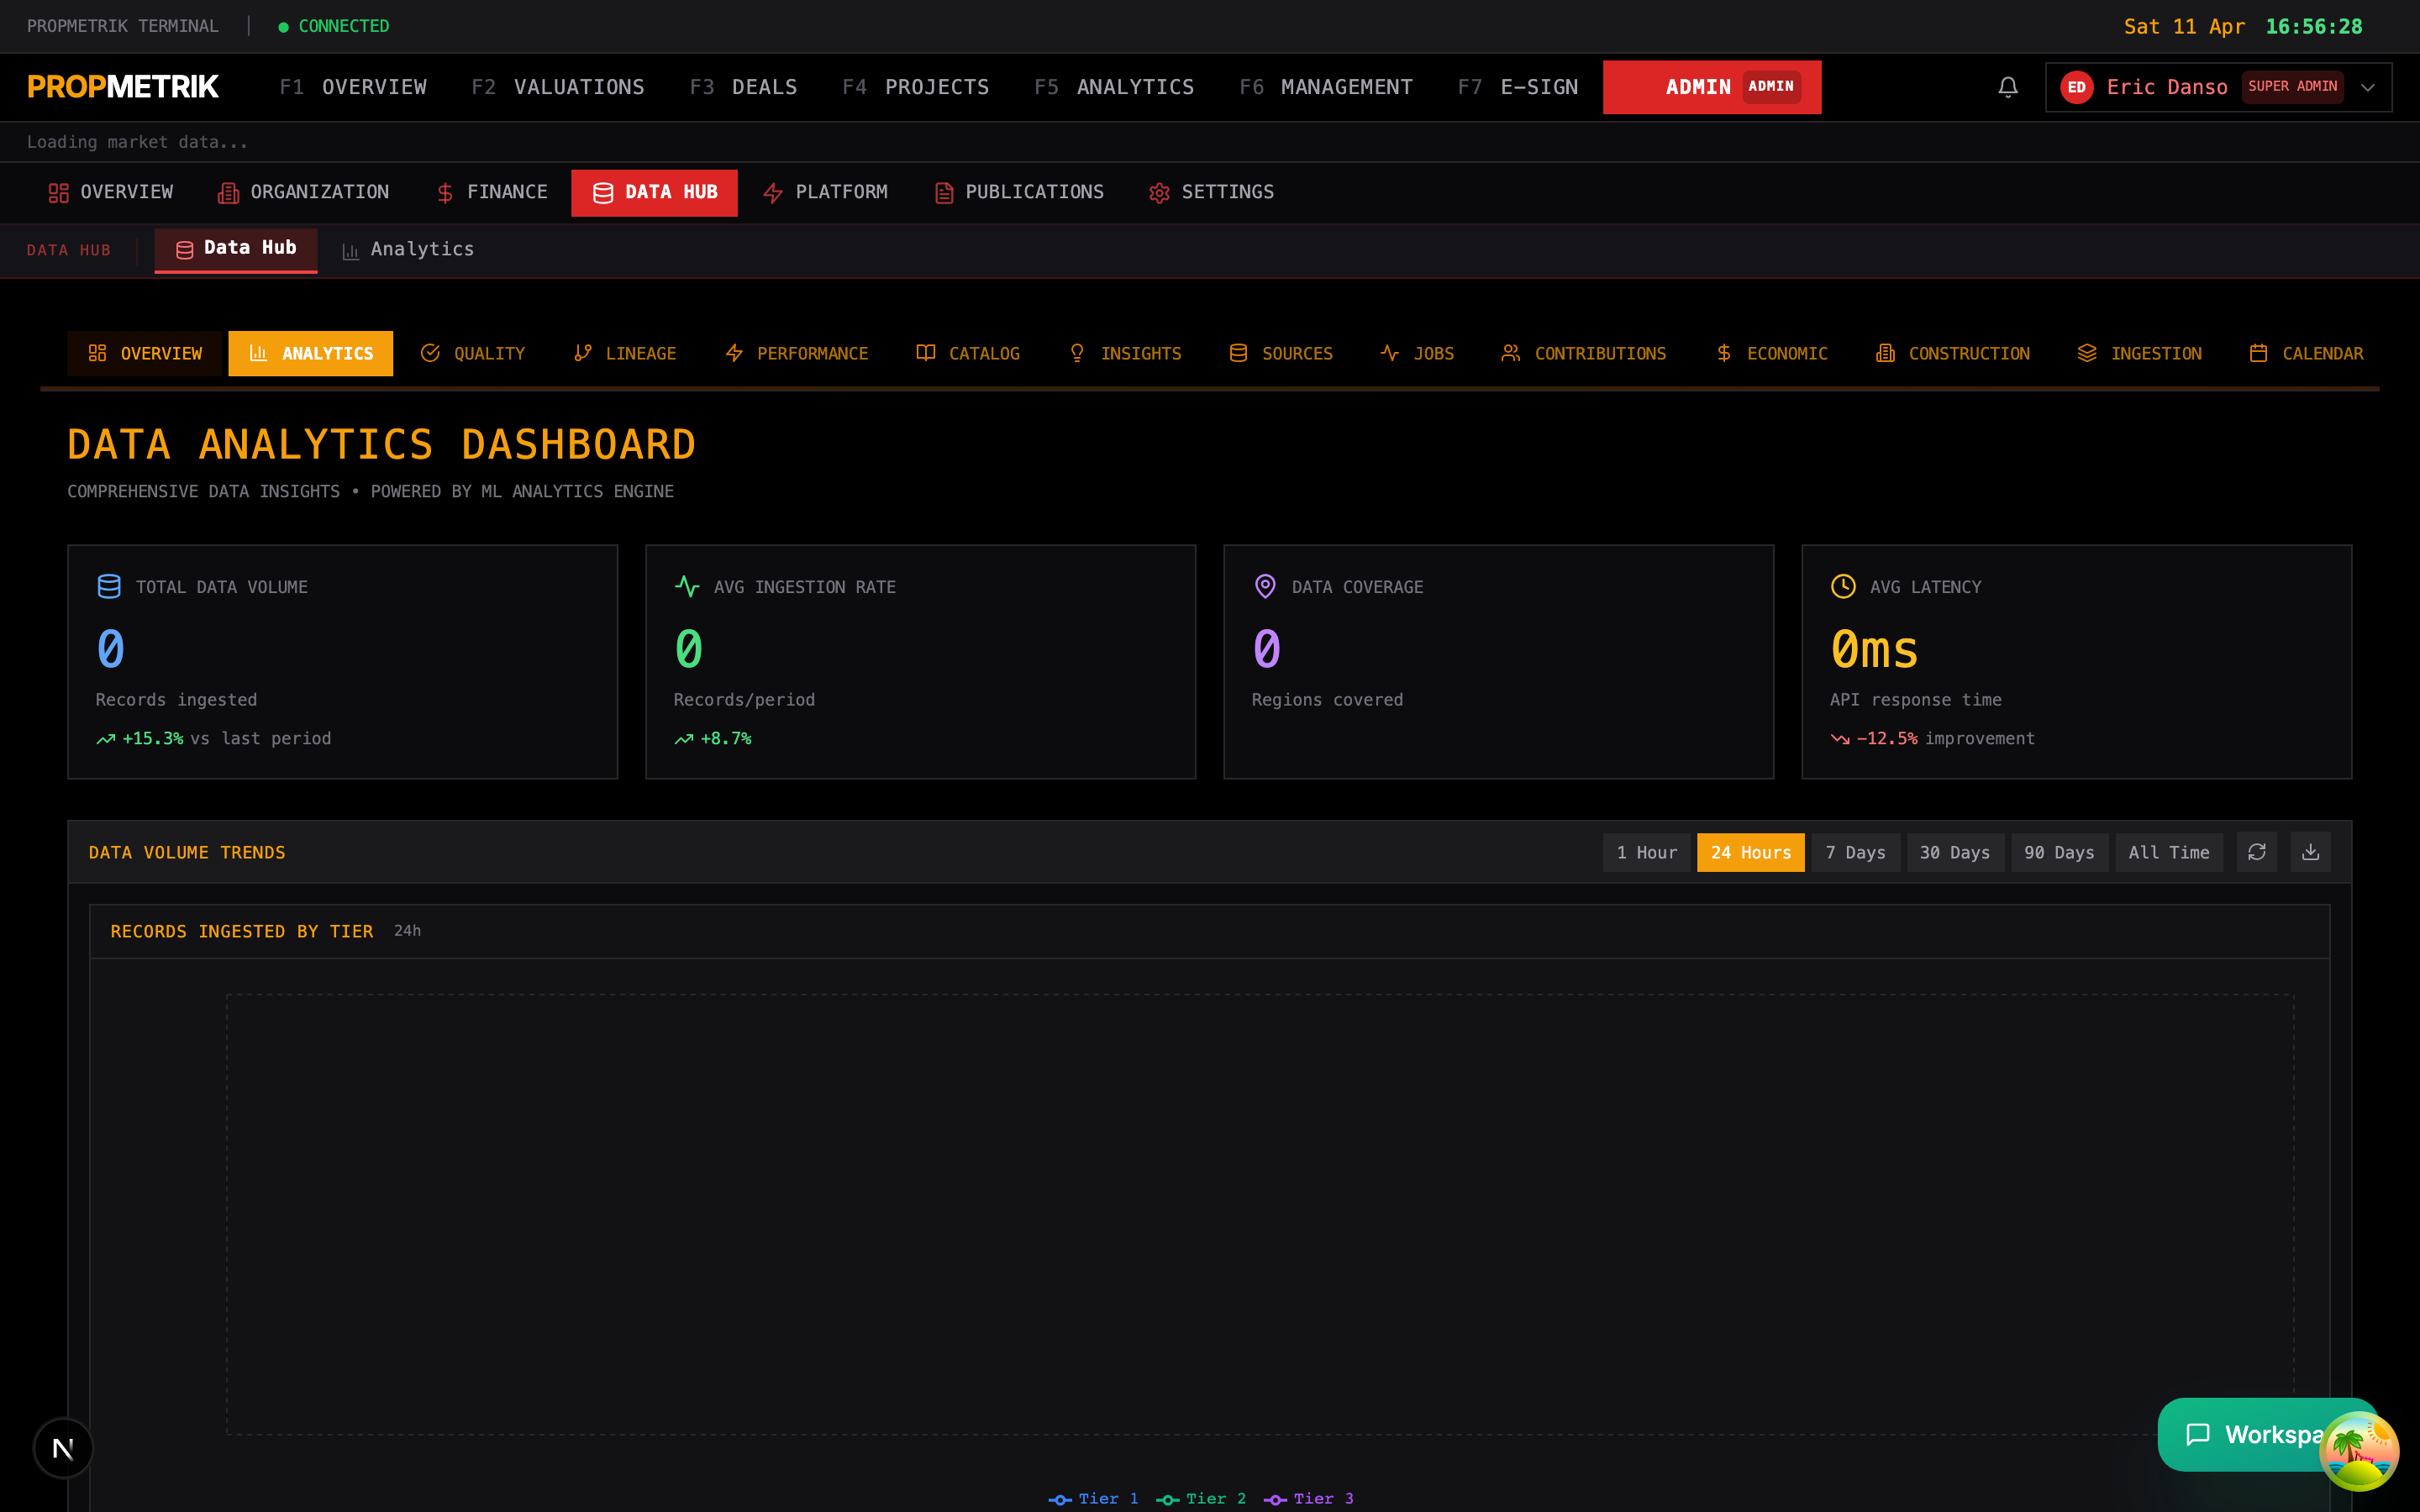
Internal analytics about the data platform itself:
- Ingestion volume over time (records per day/week/month)
- Source reliability rankings
- Data growth rates by tier
- Processing time distributions
- Error rate trends
11.21 Construction Data
Navigate to Admin > Data Hub > Construction.
Manage the underlying construction cost data that feeds the CCI:
- Material price records with supplier, region, and date
- Labour rate entries by skill level and region
- Bulk upload interface for periodic price surveys
- Historical price charts per material
- Supplier directory
11.22 Economic Data
Navigate to Admin > Data Hub > Economic.
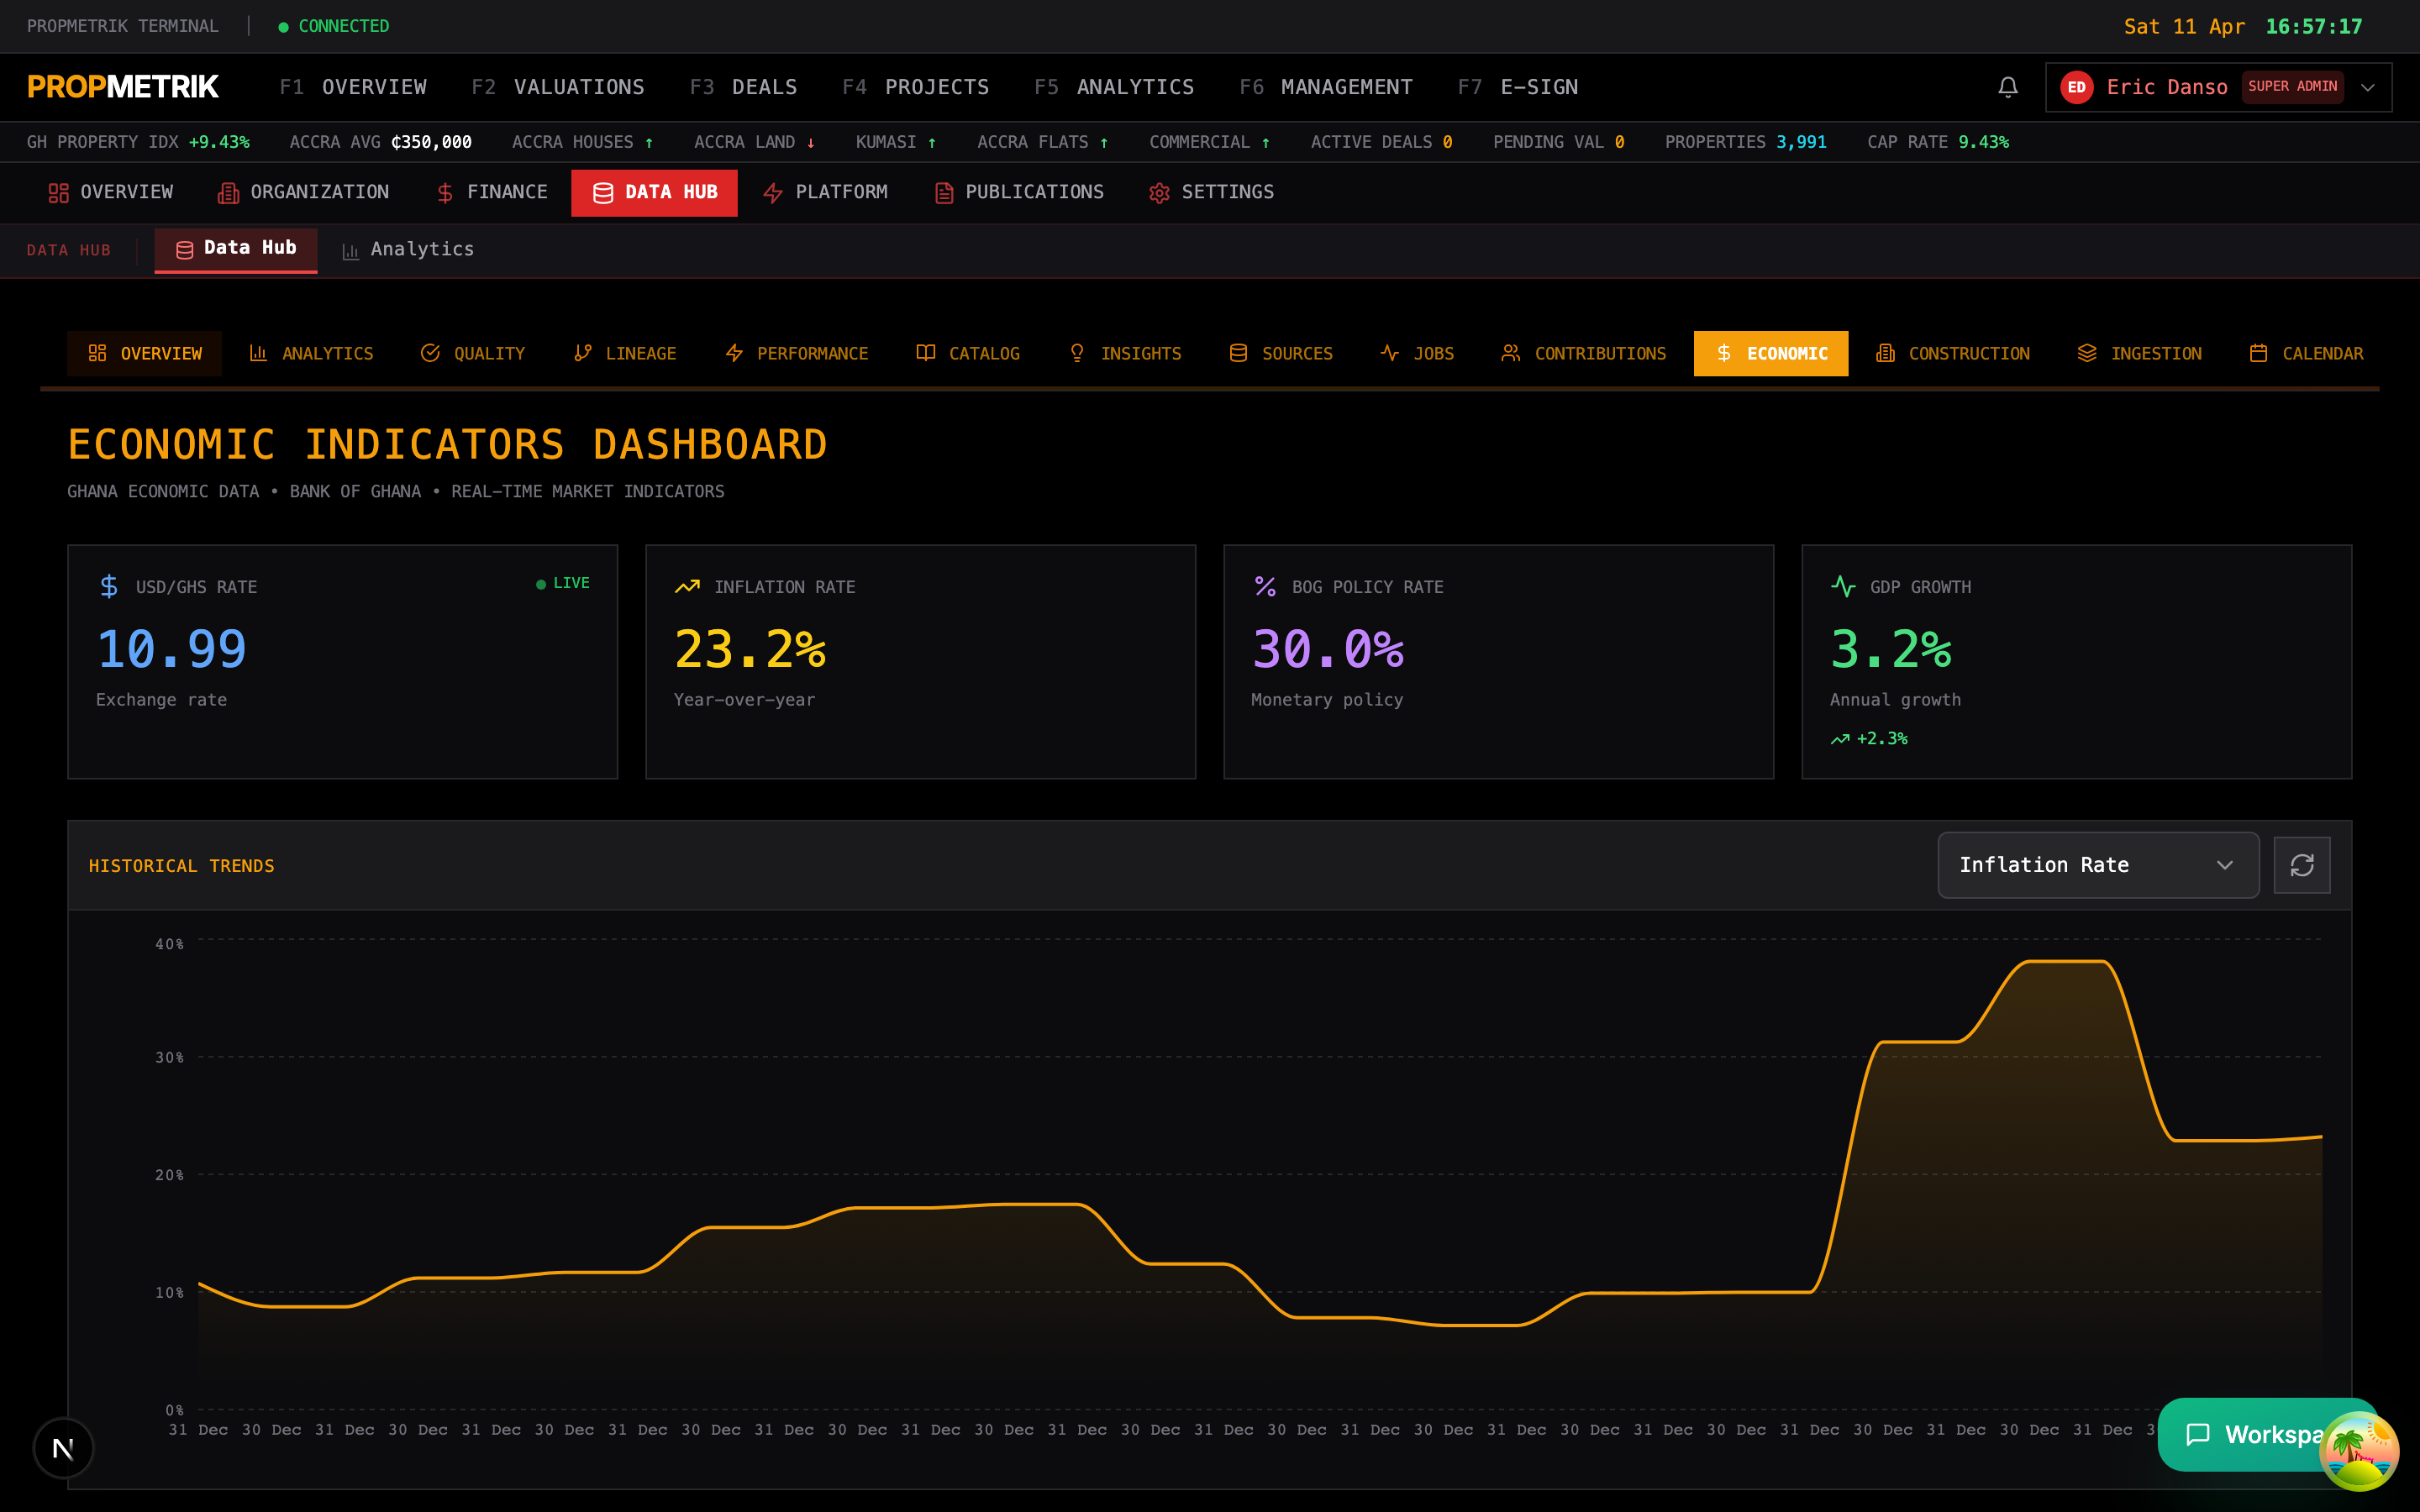
Manage macro-economic indicators used in analytics:
- GDP growth rates
- Inflation (CPI, PPI)
- Bank of Ghana policy rate
- Commercial mortgage rates
- Exchange rates (GH₵/USD, GH₵/EUR, GH₵/GBP)
- Unemployment statistics
- Building permits issued
Data is sourced from:
- Ghana Statistical Service
- Bank of Ghana
- Ministry of Finance
- World Bank
- IMF
11.23 Insights
Navigate to Admin > Data Hub > Insights.

Auto-generated intelligence reports:
- Market trend summaries
- Anomaly detection alerts (unusual price movements, transaction spikes)
- Regional comparison reports
- Seasonal pattern analysis
- Investment opportunity signals
11.24 Performance
Navigate to Admin > Data Hub > Performance.

System performance metrics:
- API response times (p50, p95, p99)
- Database query latency
- Cache hit rates
- Concurrent users
- System throughput (requests per second)
- Resource utilisation (CPU, memory, disk)
11.25 ETL Jobs
Navigate to Admin > Data Hub > Jobs.

Job List
All ETL jobs with:
- Job name and type (Extract, Transform, Load, Full Pipeline)
- Status badge (Running, Queued, Completed, Failed, Cancelled)
- Progress bar (for running jobs)
- Start time and duration
- Records processed
- Error count
Filtering
- Status filter -- show only running, completed, or failed jobs.
- Type filter -- filter by job type.
Job Actions
- Cancel -- stop a running job with an optional reason.
- View Logs -- inspect the terminal-style log output.
- Retry -- re-run a failed job.
Job Statistics
Summary cards show:
- Total jobs run
- Currently running
- Success rate
- Average duration
- Jobs in queue
11.26 Queues
Navigate to Admin > Data Hub > Queues.

Monitor and manage background processing queues:
- Queue name and purpose
- Current depth (messages waiting)
- Processing rate (messages per minute)
- Worker count and status
- Dead letter queue size (messages that failed all retry attempts)
- Oldest message age
Queue actions:
- Pause/Resume -- temporarily halt processing.
- Purge -- clear all messages from the queue (confirmation required).
- Retry Dead Letters -- re-queue failed messages for another attempt.
11.27 Pull Integrations
Navigate to Admin > Data Hub > Pull Integrations.
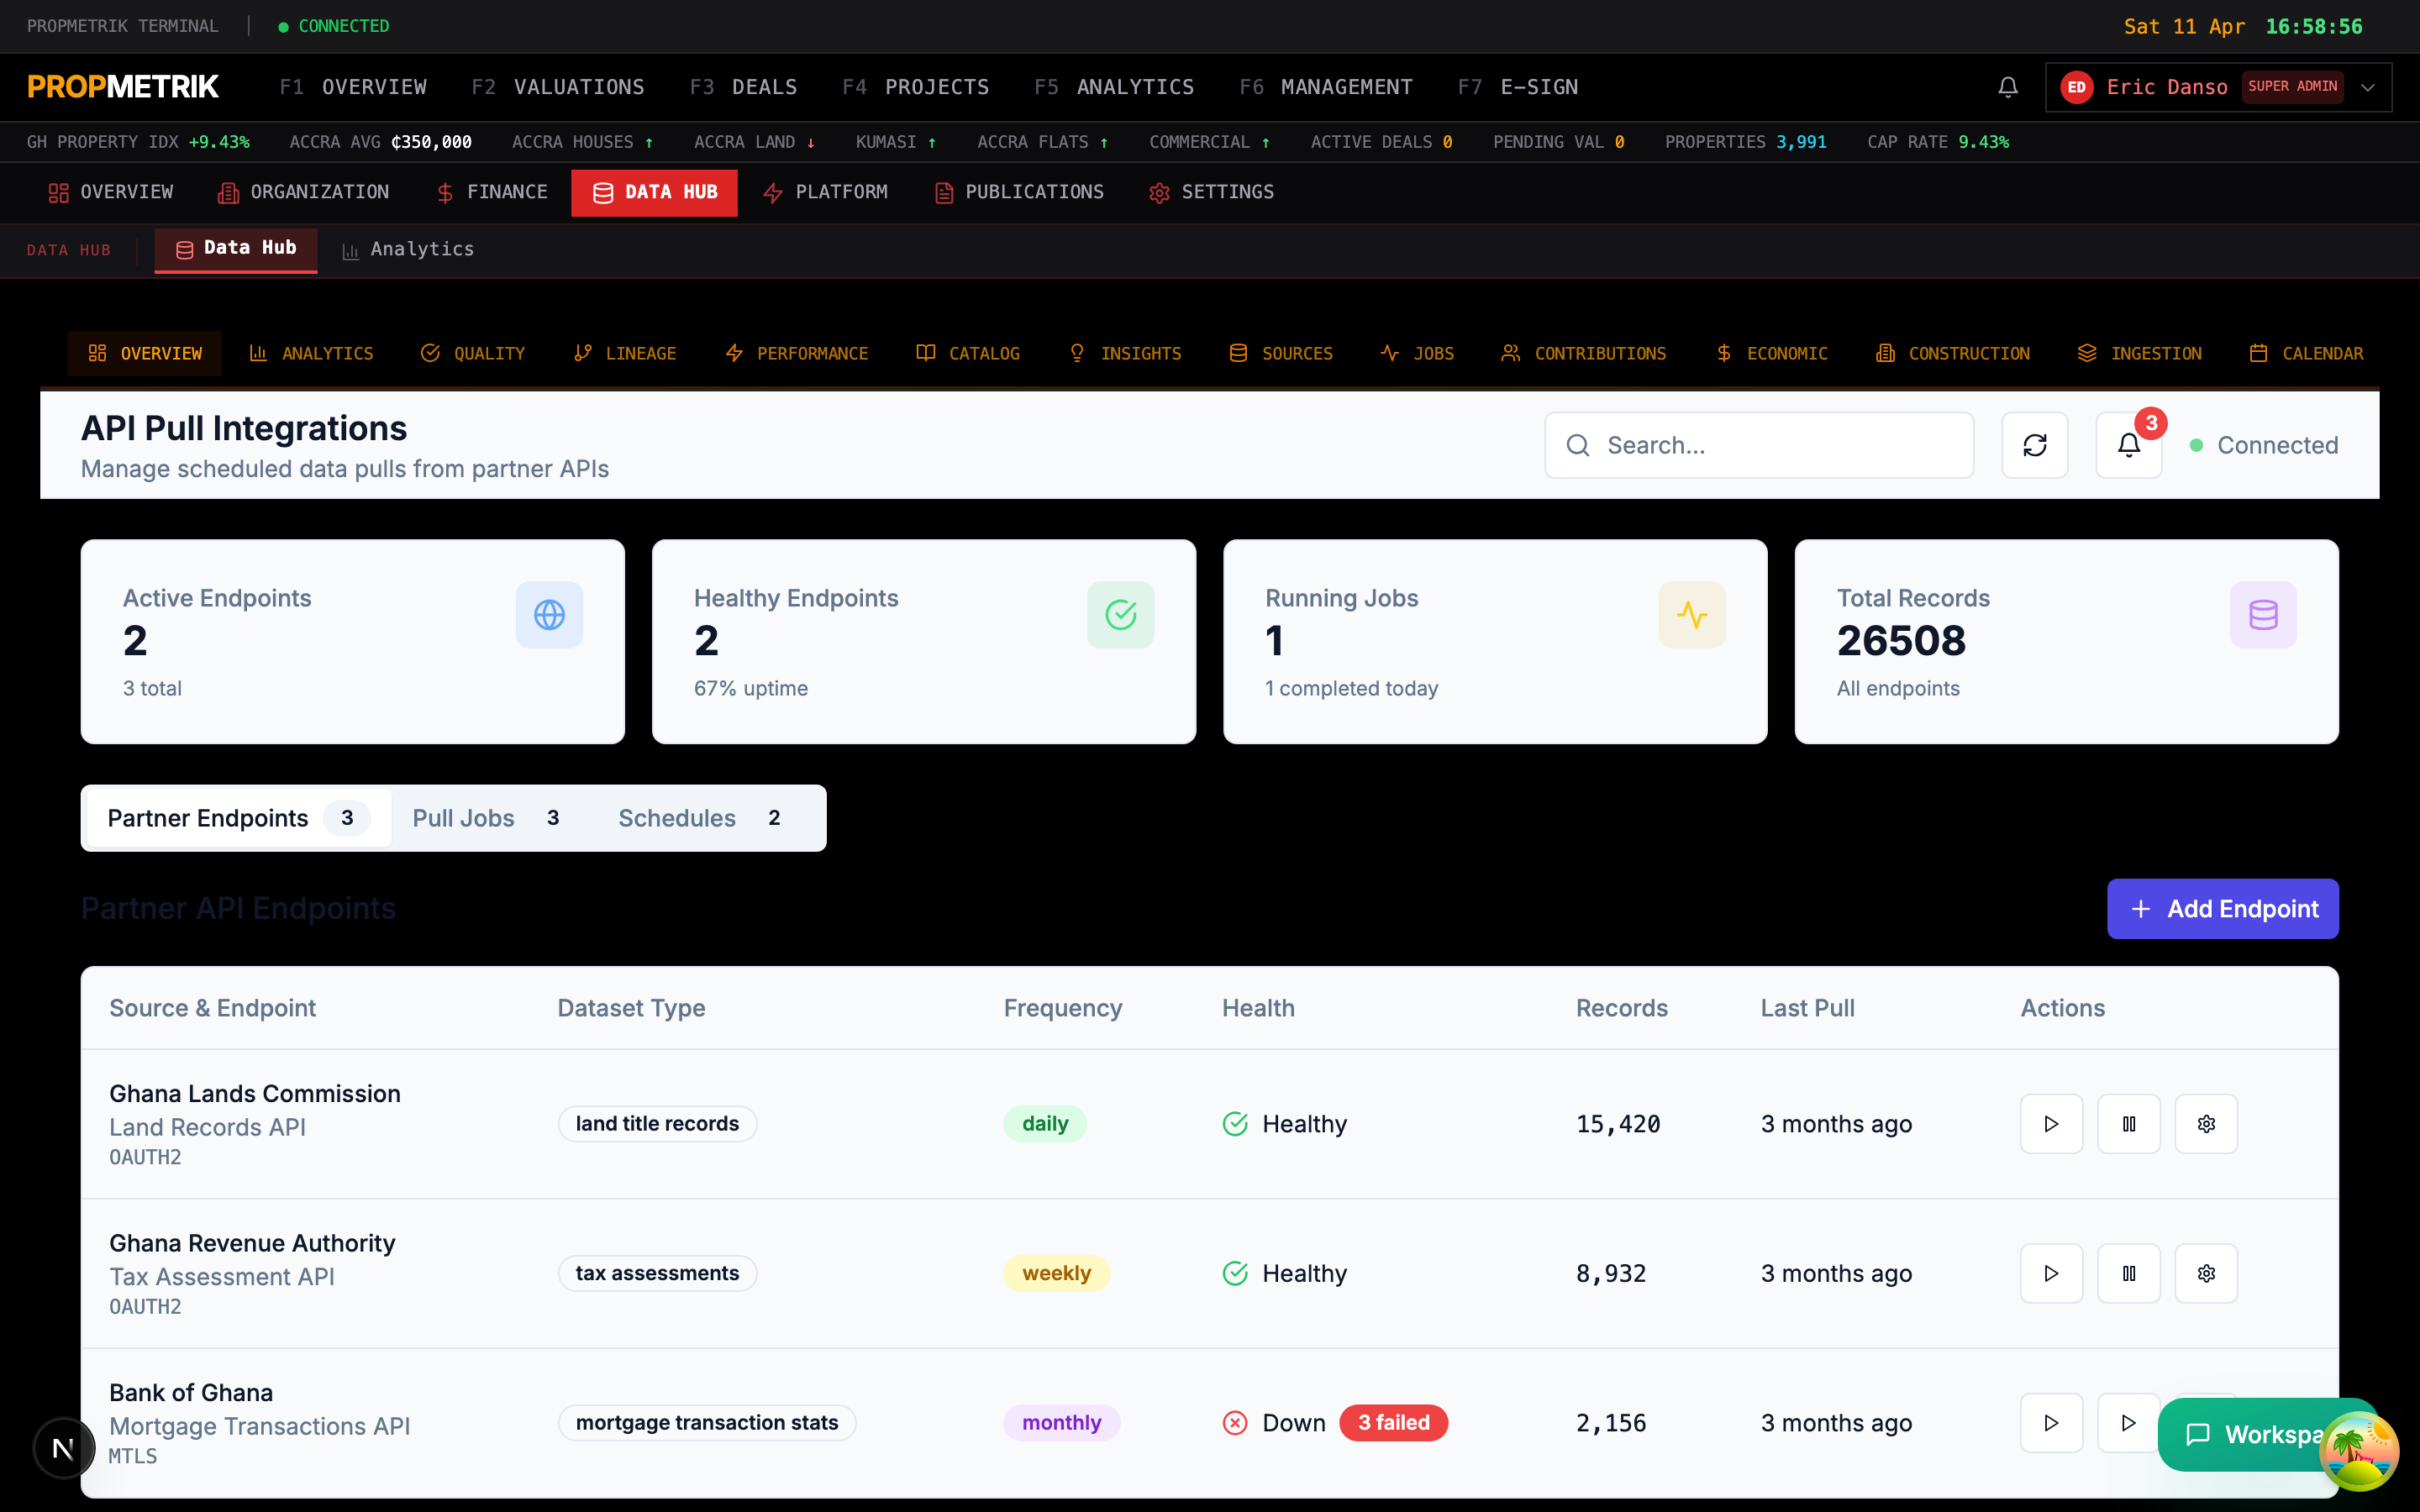
Manage scheduled data pulls from external APIs:
- Integration name and target API
- Sync schedule (cron expression)
- Last sync time and status
- Records fetched
- Authentication status
- Configuration (API keys, endpoints, pagination settings)
To add a new integration:
- Click + New Integration.
- Enter the API endpoint URL and authentication credentials.
- Configure the data mapping (source fields to PROPMETRIK fields).
- Set the sync schedule.
- Test the connection.
- Click Save & Activate.
11.28 Web Spiders
Navigate to Admin > Data Hub > Spiders.
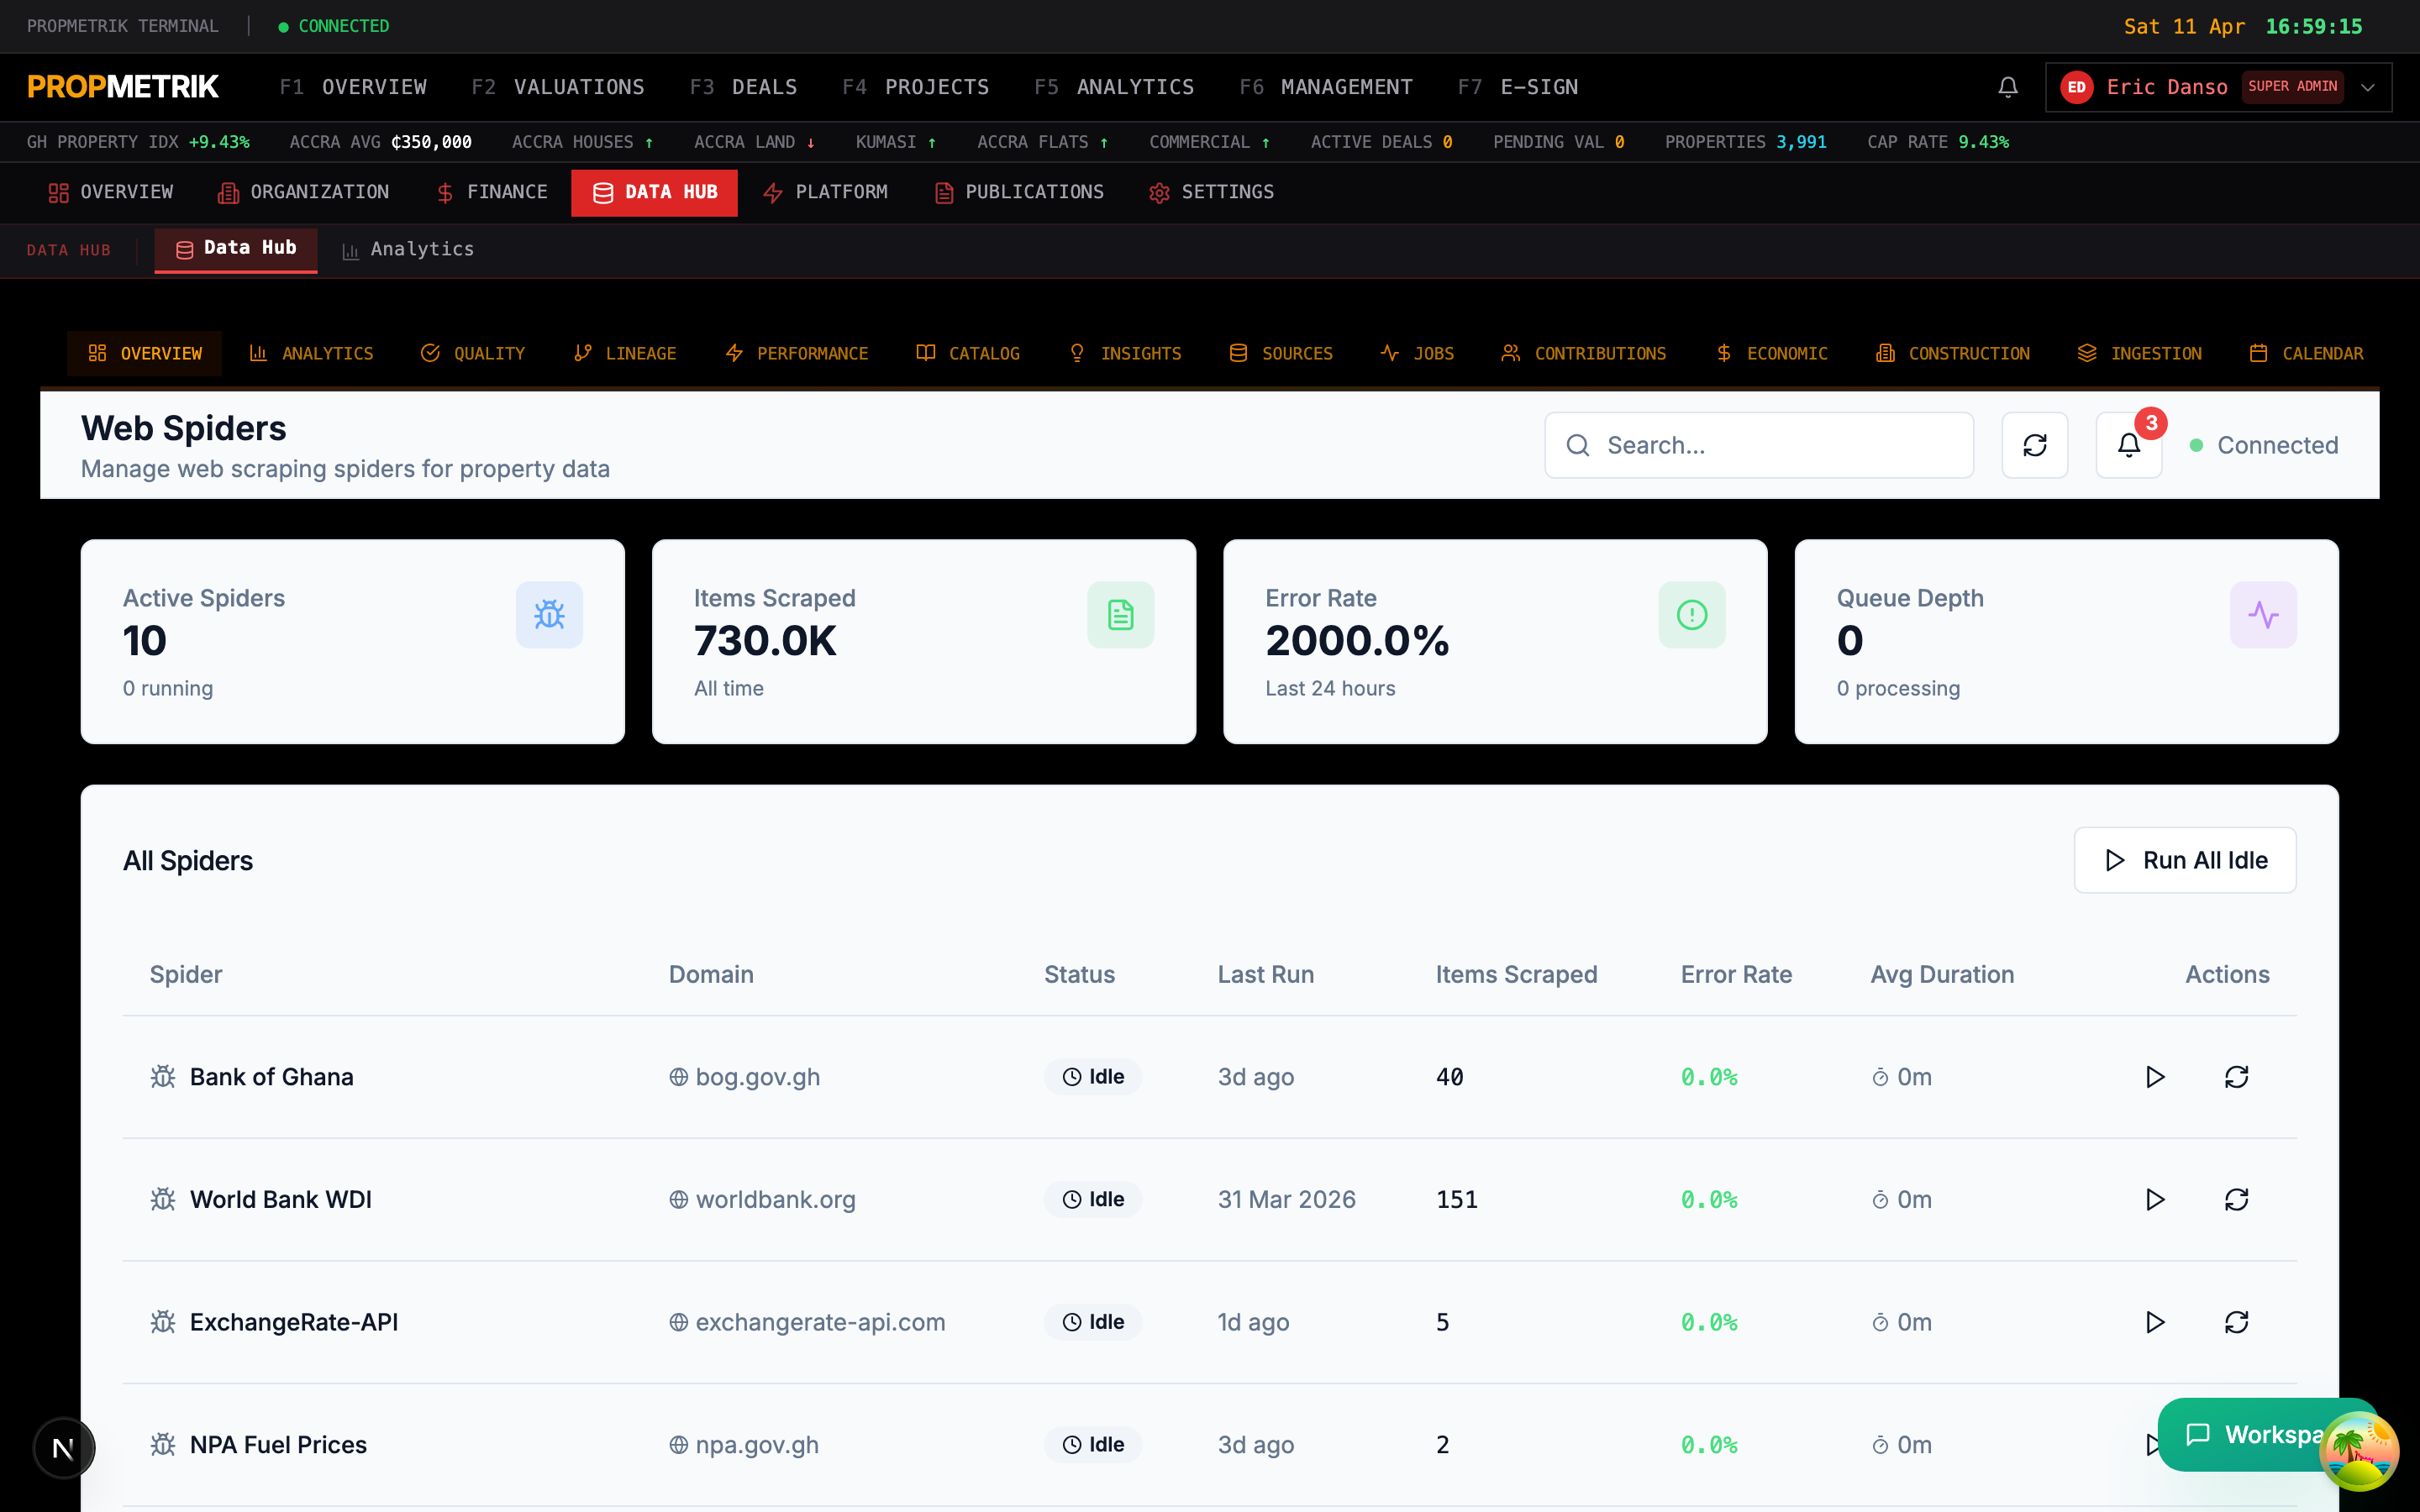
Web spiders crawl property listing websites to collect market data. Each spider targets a specific website or data source.
Spider List
Each spider shows:
- Spider name and target website
- Status badge (Idle, Running, Failed, Paused)
- Pages crawled and records extracted
- Last run time and duration
- Success rate
- Schedule
Spider Actions
- Play -- start a spider crawl immediately.
- Pause -- suspend a running crawl.
- Stop -- terminate a running crawl.
- Refresh -- update the status display.
Spider Statistics
- Total pages crawled
- Records extracted
- Error rates
- Average pages per minute
- Data freshness
Tip: Schedule spiders to run during off-peak hours (midnight to 6 AM WAT) to minimise impact on target websites and reduce blocking risk.
11.29 Contributions
Navigate to Admin > Data Hub > Contributions.
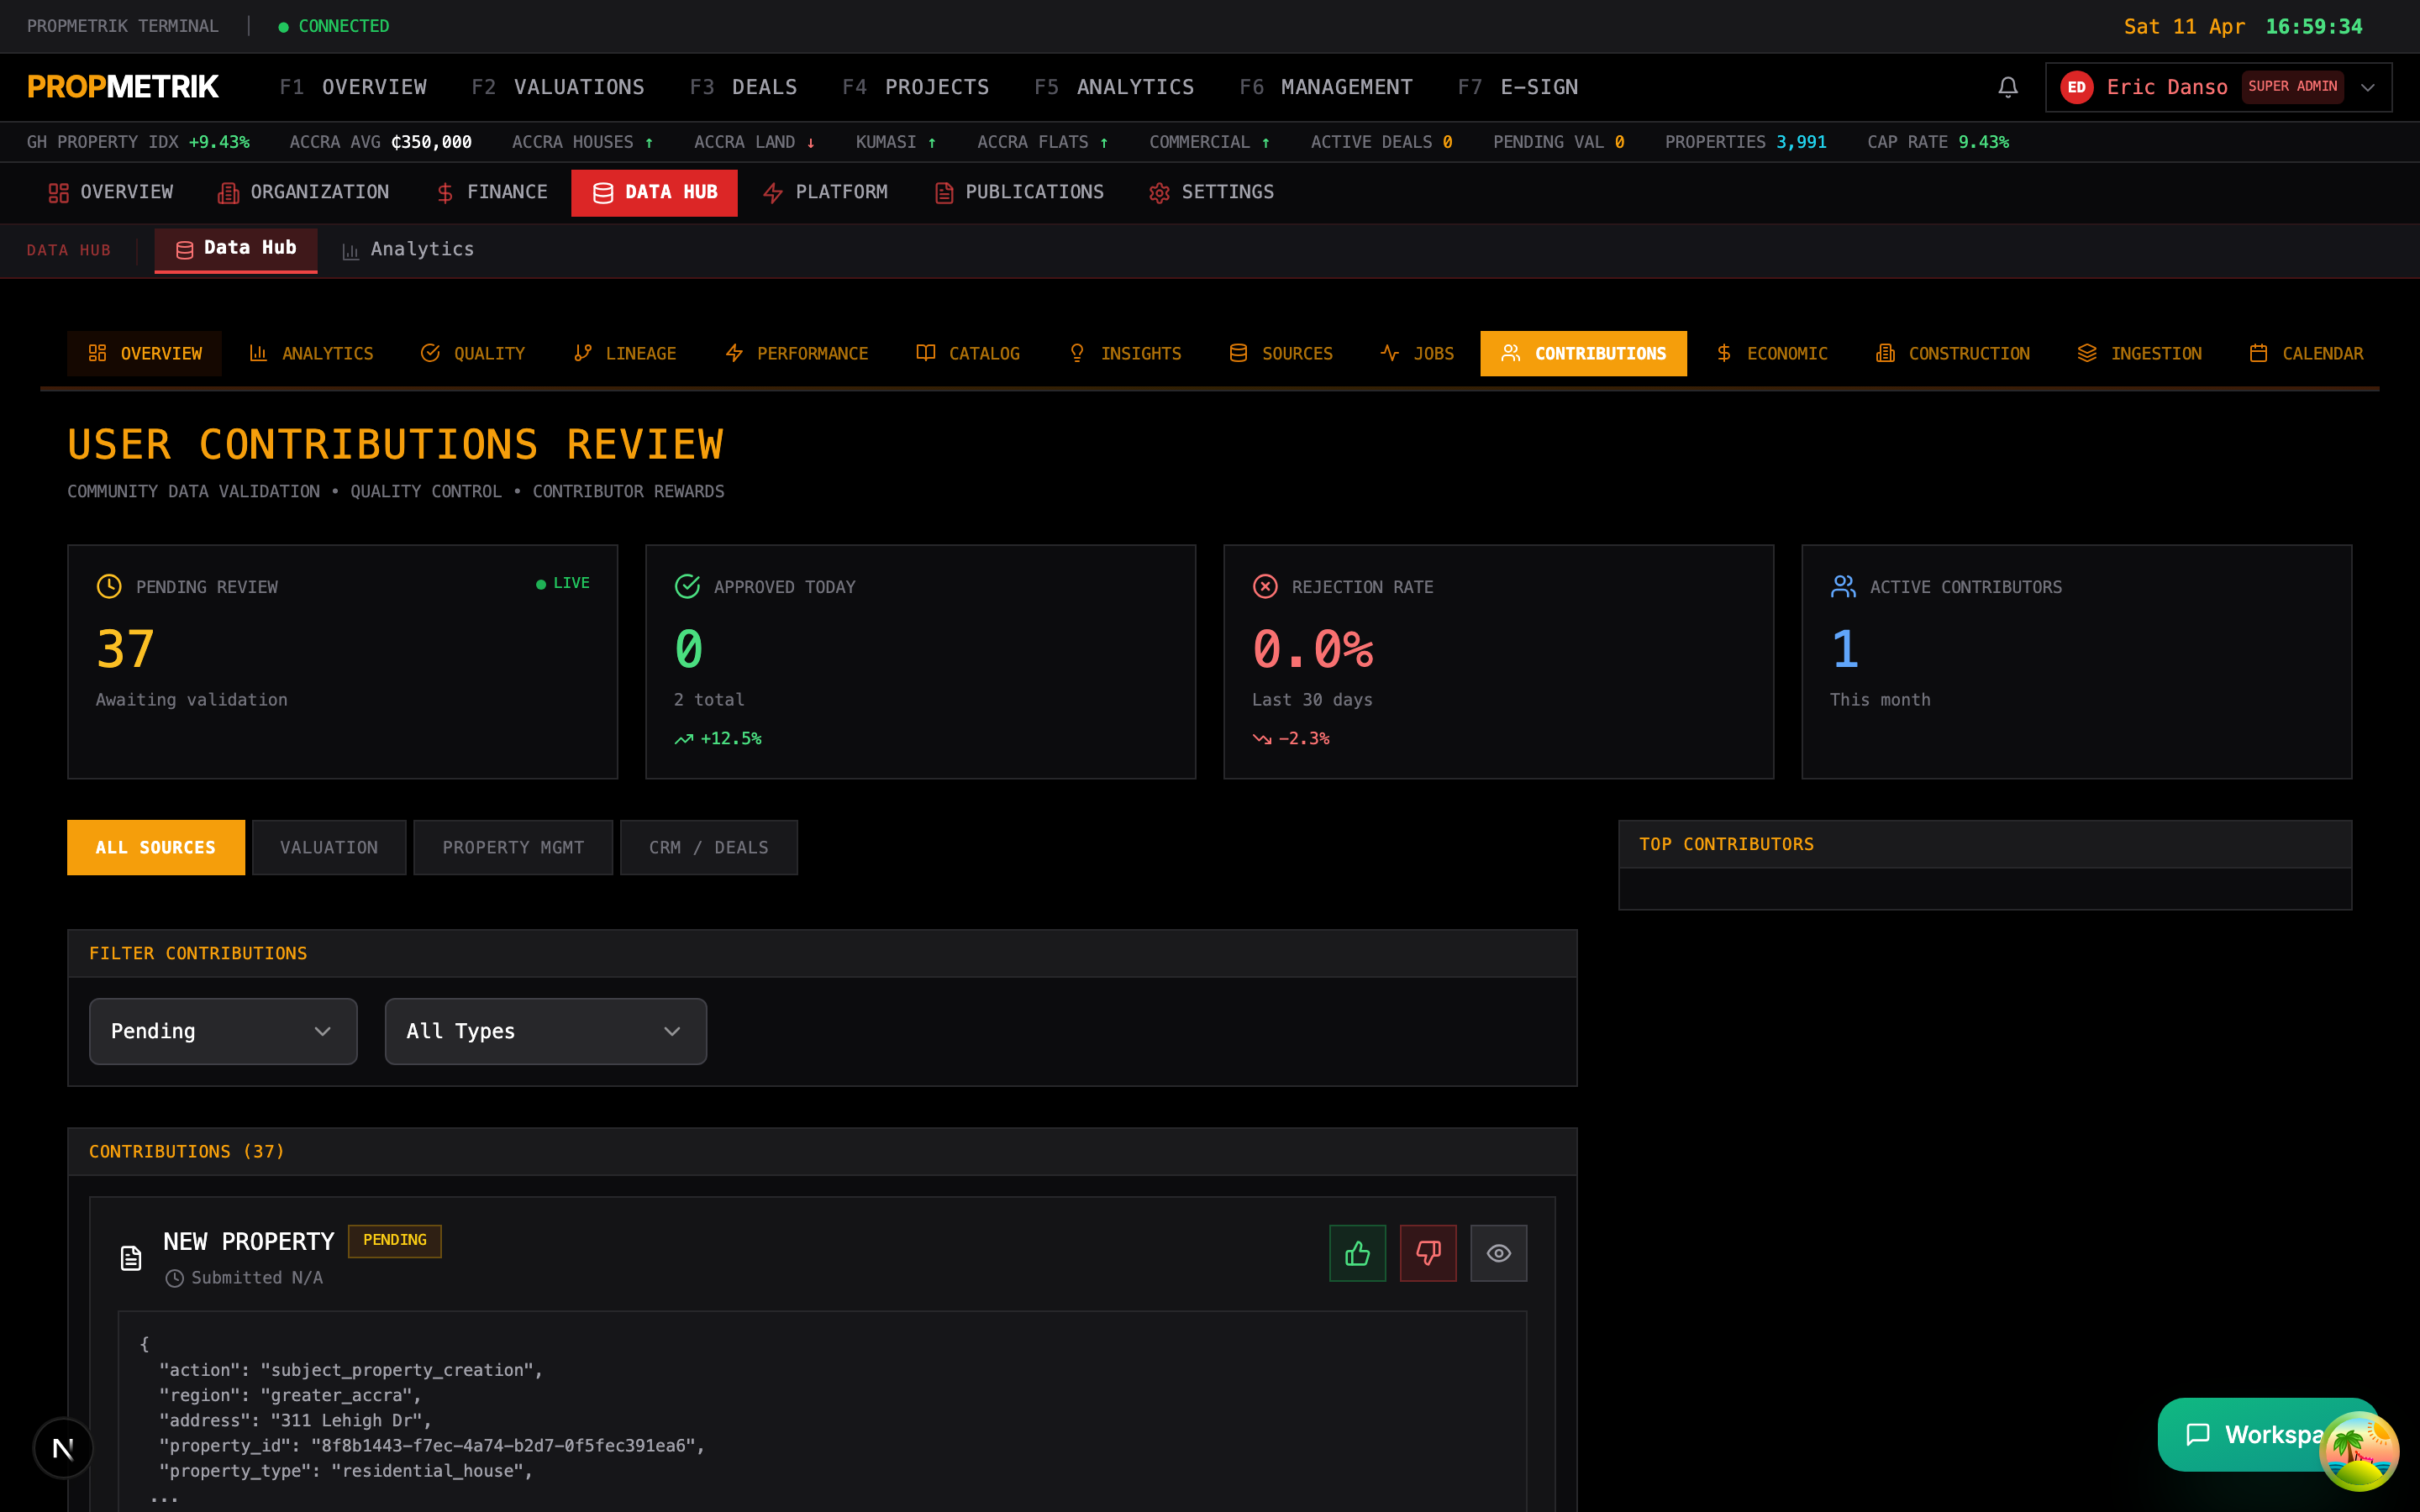
Community members and partner agents can submit property transaction data. The contributions page manages the review workflow:
Review Queue
Pending contributions with:
- Submitter name and organisation
- Property details (location, type, price)
- Transaction date
- Supporting evidence (photos, documents)
- Confidence score (auto-assessed)
Review Actions
- Click a contribution to view full details.
- Cross-reference against existing records.
- Choose an action:
- Approve -- accept the data into the platform.
- Reject -- decline with a reason.
- Request More Info -- ask the submitter for additional details.
- Flag for Review -- escalate to a senior data analyst.
Contributor Leaderboard
Track top contributors:
- Number of submissions
- Approval rate
- Data quality score
- Contributor tier (Bronze, Silver, Gold, Platinum)
11.30 Valuation Configuration
Navigate to Admin > Data Hub > Valuation Config.
Configure the parameters that drive automated valuation models:
- Comparable Selection Rules -- radius, property type matching, age limits, size variance.
- Adjustment Factors -- per-feature adjustments (e.g. +5% for corner plot, -3% per year of age difference).
- Model Weights -- relative importance of comparable sales, cost approach, and income approach.
- Confidence Thresholds -- minimum confidence score to auto-approve a valuation.
- Regional Overrides -- custom parameters for specific regions.
11.31 Data Hub Settings
Navigate to Admin > Data Hub > Settings.
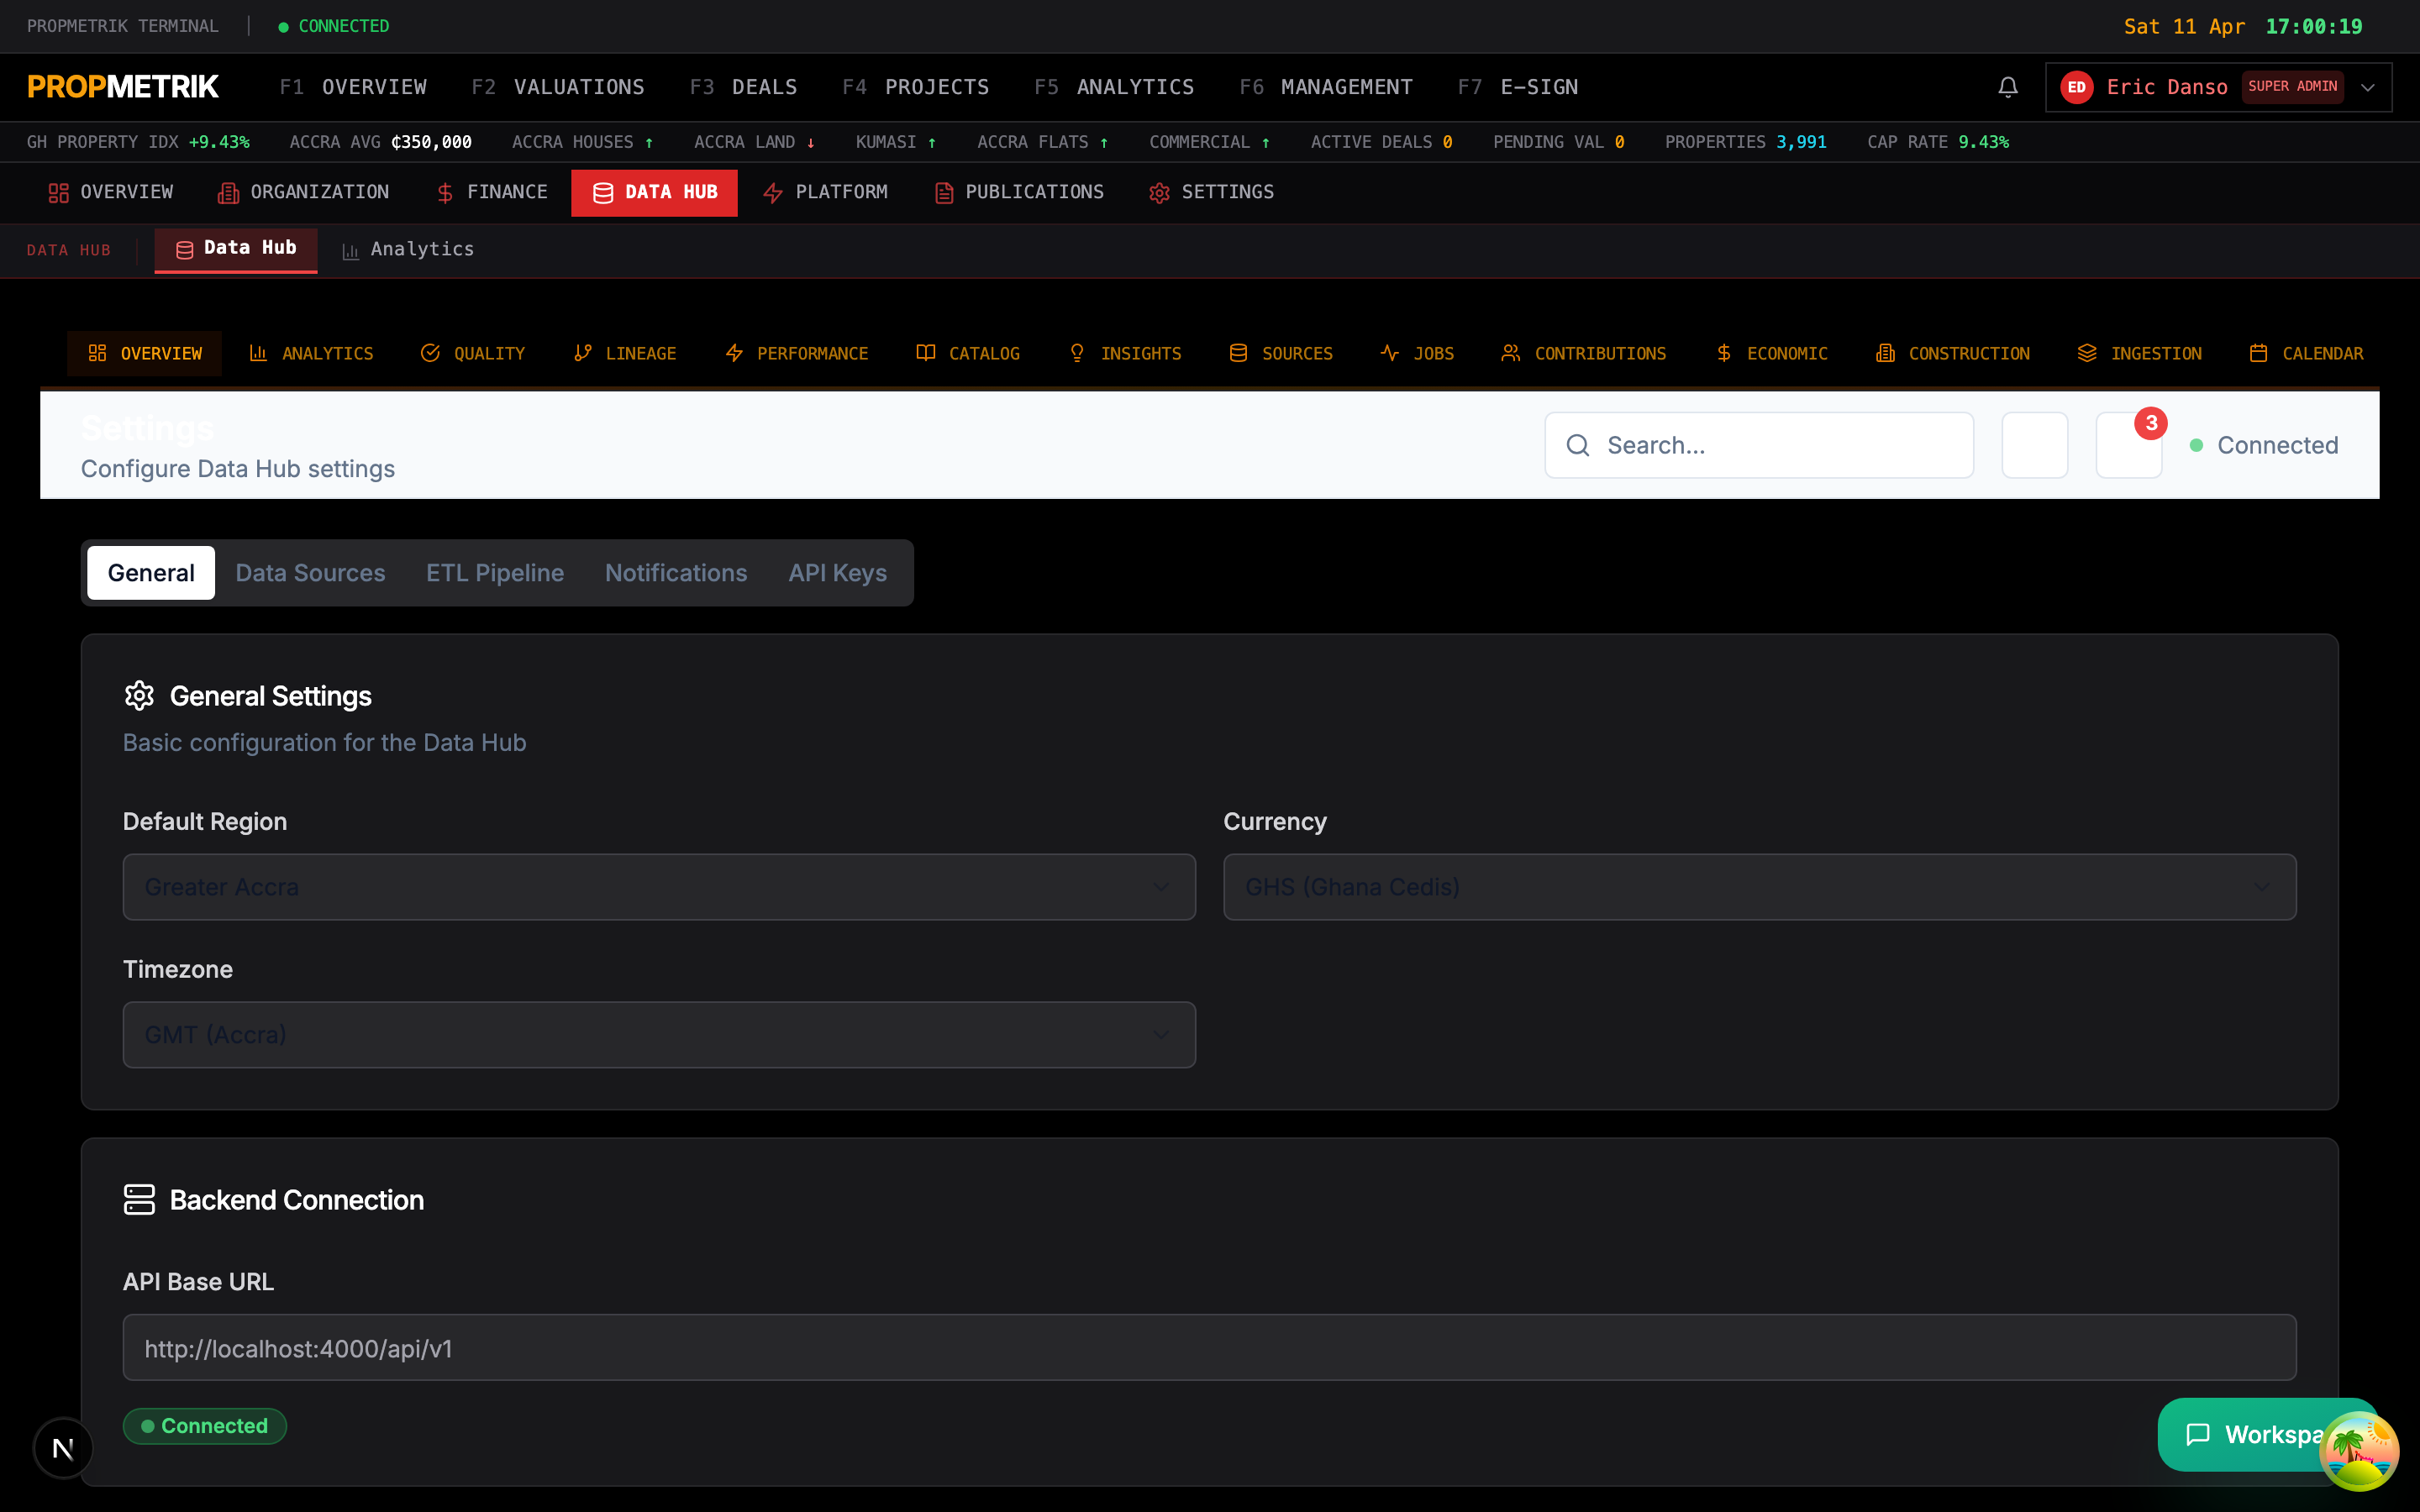
System-wide Data Hub configuration:
- API Rate Limits -- maximum requests per minute for each tier.
- Retention Policies -- how long to keep raw data, processed data, and logs.
- Notification Settings -- email/Slack alerts for job failures, quality issues, and drift detection.
- Access Control -- which roles can view, edit, or administer data hub features.
- Backup Configuration -- automated backup schedules and retention.
- Environment Variables -- API keys and secrets for external integrations (masked in the UI).
Summary
The Data Hub & Analytics module is the backbone of PROPMETRIK's market intelligence capabilities. The analytics dashboards transform raw real estate data into actionable insights -- from affordability indices and construction cost trends to ML-powered valuations and risk assessments. The administration tools give data teams full control over the ingestion pipeline, quality management, and system health. Together, they provide a comprehensive data platform purpose-built for the Ghanaian real estate market.